
Pennant Chart Pattern
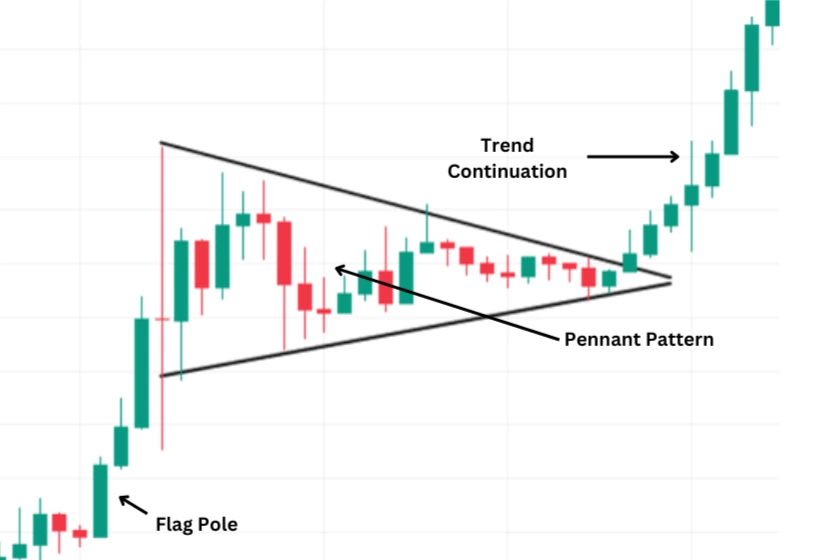
A pennant chart pattern is a type of technical analysis used in the trading market to guess how long a trend will last. People often say that this pattern looks like a flagpole because it looks like a small balanced triangle after a rapid price move. It is marked by trendlines that come together during a short time of stability.
Just like Flag chart patterns, pennants are thought to be good predictors of how the market feels, and they can be seen in both bullish and bearish markets.
How to Understand Pennant Formations?
Pennant forms after a big price change of the flagpole and is characterized by a short time of stabilization during which the price moves within the trendlines, making a triangle shape. This consolidation is a time when buyers aren't sure what to do, so the pressure to buy and sell is almost equal. Usually, the pattern only lasts a few days to a few weeks before ending. A breakout is often followed by higher volume, which means that the previous trend is back on track. Knowing how to spot pennant shapes can help buyers make smart choices since these patterns are good signs for successful trading.
Pennant chart patterns show that the trend will stop for a while and then continue. Within the chart, traders find possible signs that the price will continue to move in the same direction. It usually happens after a big price change, like the flagpole, which can go up or down. After the first move, there is a time of consolidation, during which the price moves within trendlines that are coming together to make a small symmetrical triangle, or "pennant." The consolidation phase is a short break in the market where buyers take a moment to think about what to do next.
How to identify Pennant Chart Pattern?
The most important characteristics of forming a pennant chart pattern are:
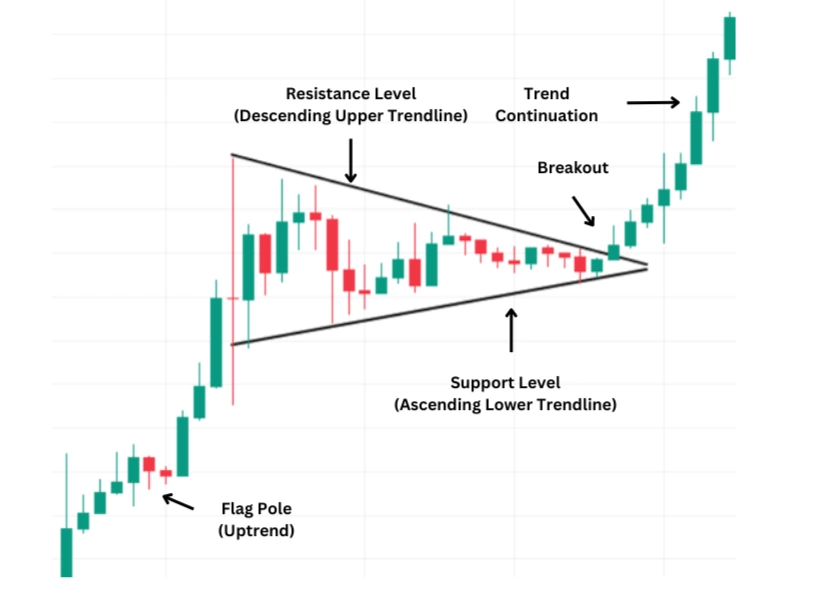
- Crossing Trendlines: It has two trendlines that come together to make a small, balanced triangle that looks like a flag or banner.
- Volume Drop: As the pennant forms, trade volume usually drops, which means that the market is consolidating.
- Increase in Volume at Breakout: A breakout is often followed by an increase in volume, which shows that the trend will continue.
- Direction of Breakout: The pattern is proven when the price moves out of the pennant in the direction of the previous trend.
- Trend Before the Pattern: The pattern comes after a strong price move, either in a bullish or bearish way.
- Short-Lasting: Pennant trading patterns only last from one to three weeks on average.
- Continuation: The previous trend is likely to start up again after the short stabilization.
What are the Benefits and Limitations of Pennant Patterns?
Traders can gain from pennant patterns in a number of ways. One of their best features is that they are good at guessing whether a trend will continue. This makes them useful for finding entry places when the market is strongly trending. It's pretty easy to spot the pattern because it has a clear form and prices move quickly followed by a short period of stability. Also, pennant trading patterns can be used on different time frames, which gives traders of both short and long terms more options.
Yet, there are some limitations that can't be do with pennant designs.
One major problem is that fake breakouts can happen, where the price moves in the direction of the breakout but then turns around, which could lead to losses. You need to have a lot of experience to correctly identify the pattern because it can look like other charts like flags or triangles. The pattern is also less accurate when markets are very unstable or noisy because price changes can be random and less predictable. Using pennant patterns alone, without looking at other indicators or market factors, can also lead to incomplete analysis and bad trading choices.
How to Trade with Pennant Patterns
To get the most out of trading with pennant trading patterns, it’s necessary to take a few steps. Firstly, find a strong first price movement, known as "flagpole." Next, look for a time of consolidation where the price moves within trendlines that are getting closer together looking like a small pennant or triangle with equal sides. During this time, traders should look for volume to drop, which means the market is taking a short break.
The breakout from the consolidation phase is the most important trade signal once the pennant pattern has been found. Most of the time, traders take positions in the direction of the rise because they think the previous trend will continue. To avoid getting false signs, it's important to wait for a proven breakout, which is usually shown by a rise in volume. A good way to lower the risks is to put stop-loss orders just below the pennant's lower trendline (for bullish patterns) or above the upper trendline (for bearish patterns).
Traders often find possible profit goals by measuring the flagpole's length and estimating how far away it is from the breaking point. This method helps to guess how the price will move after the rise. Also, to improve your chances of earning money with trades, it's better to use pennant trading patterns along with other basic indicators and research tools. This will give a fuller picture of the market and help people make better decisions.
How to Identifying the Breakout?
Finding the breakout in a pennant pattern requires taking several important factors. Traders should first keep an eye on the price movement as it gets closer to the pennant's apex. So that, as the consolidation phase draws to a finish, the price begins to move more in one direction.
A real breakthrough is verified when the price crosses the pennant's trendline boundary with more volume. In case of an upward breakout, the price must be close above the higher trendline; whereas, if the price is near below the lower trendline, it shows a downward breakout.
An important indicator that the breakout is real and not fake is the rise in volume that occurs immediately after the breakout occurs. For extra proof that the breakout is real, traders can look for other technical signs. For example, momentum indicators like the Relative Strength Index (RSI) can help to determine if the breakout is likely to sustain by indicating trading conditions.
By using various techniques together, traders can find breaks from pennant patterns more easily and make better trading.
Strategies for Trading with a Pennant Patterns
It's necessary to be focused and have a clear plan. By combining strategies, traders can effectively utilize pennant patterns to spot and perform successful deals while controlling risks. Here are a few helpful strategies:
- Recognize Pattern: Firstly, detect a significant initial price movement that produces the flagpole, then consolidation that makes the pennant. Make sure the consolidation creates a tiny symmetrical triangle.
- Confirmation: Before making a deal, it's recommended to wait for a proven breakout from the pennant. Price should move beyond the pennant trendline with higher trading volume. This can identify a real breakthrough.
- Set stop-loss orders: Place stop-loss orders above the higher trendline for a bear pennant pattern or slightly below the lower trendline for a bull pennant pattern in order to control risk.
- Use additional Indicators: Move beyond the pennant trading pattern analysis and consider combining it with additional technical indicators like MACD, RSI, or moving averages. These indications may assist to determine the strength and durability of the trend as well as provide further proof of the breakout.
- Adapt for Market Conditions: Modify your plan in light of the larger market environment. In highly unpredictable markets pennant patterns may not be as credible. Take into account news about the economy, the general market trend, and other variables that might affect price changes.
- Monitor Volume: Keep an eye on how the volume changes over time. A strong confirmation signal is a big rise in volume during the breakout. Breakouts with low volume are more likely to fail, so it's important for to see a volume rise to support it.
Bull Pennant
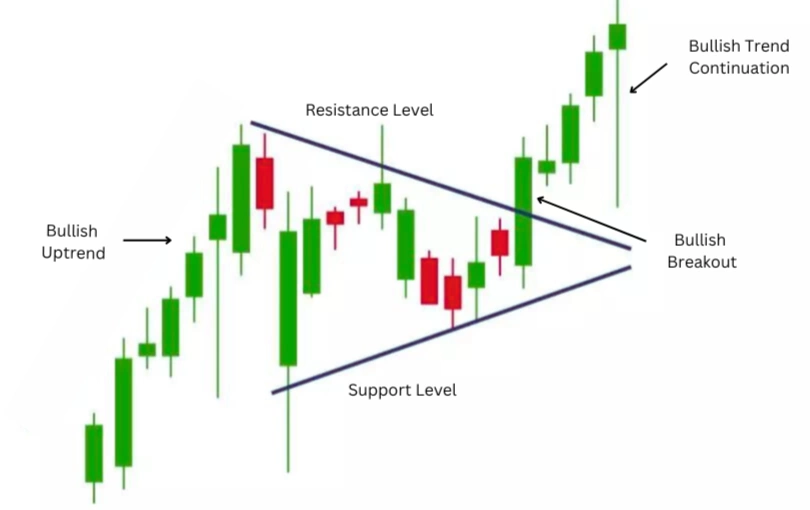
Bull pennant patterns are a type of bullish continuation pattern that generally appears during an upswing. After a short time of consolidation, it shows that the price is likely to keep going up. This pattern starts with a strong price rise, which shows that there is a lot of buying interest. After this, the price increase goes into the phase of consolidation, making a small symmetrical triangle. Converging trendlines show that the market is taking a short break while traders take their profits and new buyers get ready to join.
Finding the breakout is the most important part of dealing with a bull pennant. When the price breaks out above the top trendline of the pennant and starts moving up again, the pattern is complete. If there is a breakout, there should also be more trading, which shows that the rising trend is still going strong. Volume is very important here because it shows how strong the buying pressure was that led to the rise.
It is important to set a stop-loss order just below the pennant's lower trendline in order to control risk. This helps keep the trade safe in case the breakout doesn't work and the price goes back down.
Bear Pennant
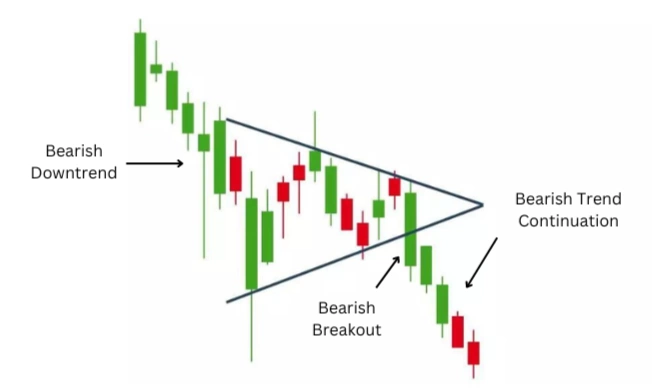
Bear pennants usually appear during a downtrend. They show that the price is likely to keep going down after a short time of stability. This pattern starts with a strong drop in price, called the "flagpole," which means there is a lot of selling pressure. The price then goes into a phase of stabilisation, making a small symmetrical triangle. In this phase, trendlines are coming together, which shows that there is a short break while traders take their profits and new sellers get ready to join the market.
When dealing with a bear pennant, finding the breakout is critical. Breaking below the lower trendline of the pennant, the price returns to its previous decline and the pattern is complete. As proof that the bearish trend will continue, a breakout should be followed by higher volume. Within this situation, volume is very important because it shows how strong the selling pressure was behind the move.
After confirming the breakout it is possible to catch the start of the next downward move. Putting a stop-loss order just above the pennant's upper trendline helps keep the trade safe in case the breakout doesn't work and the price goes back down.
Risk Management and Considerations
Trading pennant patterns, whether they are bullish or bearish, requires careful risk management to lower the chance of losses and increase profits. Adding risk management tips into the trading plan can increase the chances of making profitable trades while lowering the risks of losing money.
- Stop-Loss Orders: Make sure stop-loss orders are placed just outside of the pennant pattern. Place a bear pennant above the higher trendline and a bull pennant under the lower trendline. Stop-loss levels should be modified in accordance with market circumstances and volatility.
- Volume Confirmation: Verify breakouts with a higher volume. The breakout strength is confirmed by high volume, which lowers the possibility of fake signals. Low-volume breakouts are less trustworthy and could be signs of reversals.
- Market Conditions: Look for wider economic data and market trends. Pennant trading patterns are most effective in trending markets. In rough or volatile situations, avoid pennant trading as breakouts may be less dependable.
- Other Indicators: Multiple confirmations make trade choices more reliable. To validate the strength of the pattern and possible breakout, use additional technical indicators like moving averages, RSI, or MACD.
- Adaptation: Always look over your trades and adapt your plans based on how they're doing and what the market is telling you. To get better at trading, it’s good to learn from both good and failed trades.
Advanced Concepts
To trade more advanced pennant patterns, you need to know a lot about technical analysis.
Traders look at many time frames and do a lot of complex volume analysis to check patterns and make sure they are in line with larger trends. Advanced technical analyses help to identify failed pennant formations and tell the difference between pennant and flag patterns.
Failed Pennant Formations
In trading, failed pennant formations can be upsetting and hard to handle. They happen when the expected breakout from the pennant chart patterns doesn't go as planned, which could mean losses or missed chances. Here is why failed pennants happen:
A typical problem is that there isn't enough volume confirmation during the breakout. If you want to be sure that pennant chart patterns will continue, there should be a big rise in trading traffic. Without a strong volume to go along with the breakout, the signal doesn't have the market activity it needs to keep the price moving, which often leads to false signals.
Pennant patterns that don't work can also be caused by false breakouts. This happens when the price quickly goes outside the pennant lines but doesn't keep moving in that direction. False breakouts can happen when the market is manipulated, when big news hits quickly, or when there isn't enough regular buying or selling pressure.
Also, technical signs that don't agree with each other can make pennant formations less reliable. To avoid trading on signals that aren't clear, traders need to carefully look at the bigger picture of technical factors and how they might combine with other chart patterns.
Pennant patterns can also be wrong when the marketplace mood changes. Unexpected economic changes, news, and global events affect and change the way the market works, making the pattern fail.
Moreover, mistakes in recognising patterns or predicting pennant formations too early can cause a failure. Traders need to be able to tell the difference between pennants and other patterns that look like them, like flags or triangles, so they don't catch false signs.
Pennant vs. Flag Pattern
Technical analysis uses pennant and flag patterns, which both show that prices might keep going after a short break. Although these patterns have some things in common, they also have unique features that buyers should be aware of.
Pennants usually show up as a triangle with two equal sides after a big price change. When trendlines come together, they make this form, which shows a short time of consolidation. Meanwhile, flag patterns look more like rectangular consolidations inside concurrent trendlines.
Flags are most common when prices are going up. Pennants can show up in both uptrends and downtrends, but flags tend to show up mainly in uptrends. Such variation in trend direction affects how traders understand these patterns and respond right at the moment.
Flags tend to last longer than pennants, but pennants can last from a few days to a couple of weeks. In contrast to flags, where prices may move more slowly, this shorter time of stabilisation often leads to breaks that happen much more quickly and explosively.
In summary, recognising the differences between pennant and flag patterns enables traders in identifying possible price chances and make good trading decisions.
Conclusion
To summarise, recognising pennant patterns may greatly improve a trader's ability to detect and capitalise on market movements.
To trade successfully with pennant patterns, volume factors, confirmation indicators, and risk management tactics like stop-loss orders must all be carefully considered. Navigating the complexity of these patterns requires integrating technical research with larger market considerations and constantly improving trading approaches via experience and learning.
Traders who learn these ideas may enhance their decision-making processes and overall profitability in a variety of market scenarios.
FAQ
What is a Pennant Chart Pattern?
A pennant pattern is a continuation pattern that appears on a chart following a significant price movement. It is identified by convergent trend lines and is usually followed by a breakout.
How important is Pennant Chart Pattern?
The pennant chart pattern is valuable because it enables traders to make better trading decisions by assisting them in locating possible continuation points.
How does a pennant chart pattern work?
Following a big price move, a pennant chart pattern consolidates the price inside convergent trend lines, signalling a pause before the trend continues in the same direction.
What are the key features of a pennant chart pattern?
The key aspects include a strong initial price movement (flagpole), a tiny, symmetrical consolidation phase with converging trend lines, and a breakout in the direction of the original trend.
Can a pennant pattern form during an uptrend, downtrend, or a sideways movement?
A pennant pattern usually appears during an upswing or decline, not during a sideways movement.
What are the types of pennant chart patterns?
Pennant chart patterns are classified into two types: bullish pennants, which occur during uptrends, and bearish pennants, which form during downtrends.
What is the best way to trade a pennant pattern?
The ideal strategy to trade a pennant pattern is to wait for a breakout in the direction of the initial trend before entering a trade with proper risk management.
How to trade a Bullish Pennant Pattern?
When the price breaks above the bullish pennant's upper trend line, start a long position with a stop loss below the pattern.
How to trade a Bearish Pennant Pattern?
After the price breaks below the bearish pennant's lower trend line, initiate a short position with a stop loss above the pattern.
What indicator is best to trade with a pennant pattern?
Volume is important when trading pennant patterns since a large volume rise follows the breakout.
What is the accuracy rate of a pennant pattern?
Pennant patterns can be inaccurate, but when corroborated by other technical analysis tools, they are usually trustworthy continuation patterns.
How reliable are pennant patterns?
Pennant patterns are trustworthy when accompanied by strong volume and other technical indications, but they should be applied alongside other analysis.
How to differentiate between a pennant and a symmetrical triangle?
A pennant pattern appears after a quick price change and is usually smaller and lasts shorter. A symmetrical triangle pattern, on the other hand, appears over a longer period of time and is more of an uncertain pattern.
Disclaimer: Includes third-party opinions. No financial advice.


