On This Page
The Ascending Triangle Pattern
The ascending triangle, also known as the rising triangle and flat-top, is a continuation pattern that occurs within a trend. It is a type of Triangle pattern that signals a trend breakout. As the name suggests, an ascending triangle on a chart is formed when the price gathers between an ascending trend support line and a horizontal resistance line.
It is important to recognize ascending triangles for identifying potential breakouts and upward price movements. In this article, we'll learn what an ascending triangle pattern is, how it shows up, trading tactics, advantages, and disadvantages of using this pattern on charts.
Key Takeaways
- Ascending triangle as a useful pattern for discovering potential trends.
- Buyers and sellers' behaviours using an ascending triangle.
- The bullish bias of the pattern is perceived as a signal to continue the trend.
- A breakout accompanied by high volume suggests greater market participation.
What Does an Ascending Triangle Look Like
The ascending triangle pattern is a figure that predicts a possible price increase. It is a bullish continuation pattern that typically forms during an uptrend.
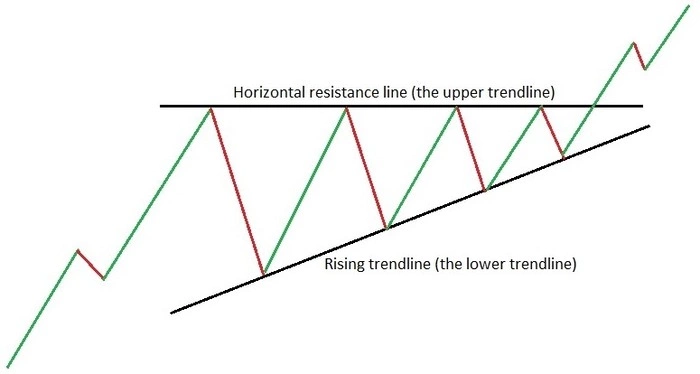
It consists of a horizontal resistance line (the upper trendline) and a rising trendline (the lower trendline). The beginning and end of the horizontal line are at the same level and the lower trendline is rising from bottom to top and its left extreme point is lower than the right. The price shifts between these two lines, creating a triangle shape.
The horizontal upper trendline indicates a lack of significant selling pressure. Sellers are unable to consistently push the price lower, resulting in repeated highs around the same price level. As buyers become more active, they are able to push the price higher, forming the rising lows which signifies increasing buying pressure.
The logic behind ascending triangles
The whole logic behind the ascending triangle shows that in a particular segment, the interest of sellers is weakening since each subsequent low in the segment is “more expensive” than the previous one. Therefore, the bottom line of the pattern is “pressing in”. At the same time, buyer interest is growing in the ascending triangle - the highs are “lined up” in a horizontal line, which acts as a resistance level. In such a situation, there is a high probability that the resistance level will be broken and an even larger mass of traders will “go long”. If an ascending triangle chart pattern appears in a bullish trend, the pattern is perceived as a signal to continue the trend.
Interpretation and Trading Signals
So, how it goes for buyers who gradually push the price higher, while sellers are unable to suppress it significantly, as shown by the horizontal upper trendline?
Strengthening buying pressure
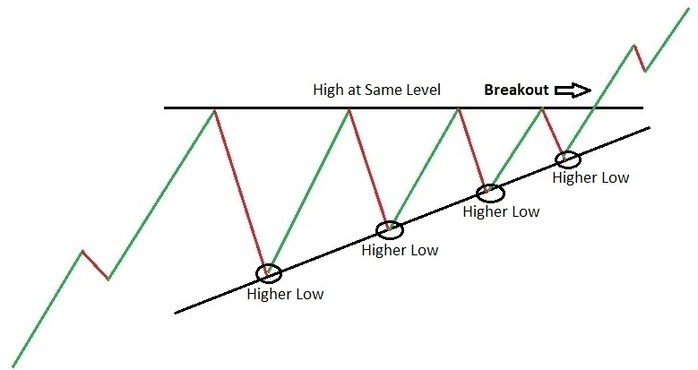
In the triangle pattern, the horizontal upper trendline represents a level at which sellers are constantly attempting to push the price down. However, despite their efforts, the price fails to make lower lows, indicating that buyers are stepping in to buy at higher prices. This inability of sellers to push the price lower suggests weakening selling pressure.
Meanwhile, the rising trendline below shows that buyers are becoming increasingly aggressive, and willing to buy at higher prices. This upward trendline indicates a strengthening buying pressure.
Period of equilibrium
As the price continues to oscillate between these two trendlines, it signifies a period of equilibrium between buyers and sellers. However, since the lower trendline is going upwards, it suggests that buyers are gradually gaining control, pushing the price higher over time.
Period of accumulation
The main performance of the ascending pattern often results in a breakout to the upside, where buyers overwhelm sellers, leading to a significant price movement upwards. This breakout is typically accompanied by increased volume, confirming the validity of the pattern and signalling a continuation of the previous uptrend.
Overall, ascending triangles indicate a period of accumulation where buyers are gradually pushing the price higher, while sellers are unable to suppress it, as seen by the horizontal upper trendline. This dynamic reflects a bullish sentiment in the market, with increasing demand for the asset.
The significance of breakouts from the triangle
The ascending pattern usually appears during persistent upward trends. Most technical analysts view this as a “continuation pattern,” meaning the overall market trend is likely to continue.
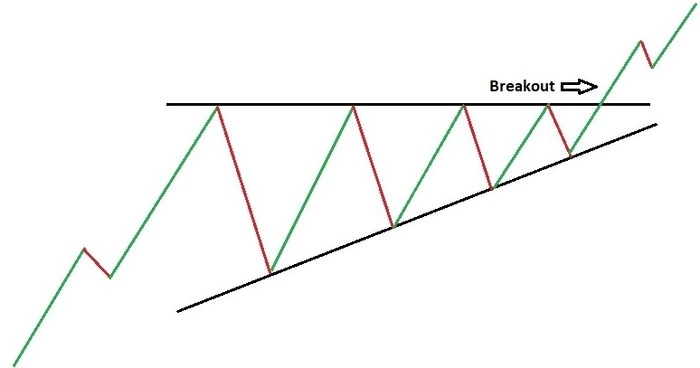
A breakout happens when the price decisively moves above the upper horizontal trendline of an ascending triangle pattern, showing a shift in market sentiment. It signifies that buyers have overwhelmed sellers, leading to a strong demand for the asset at higher prices. Breakouts are significant because they often mark the start of a new trend or the continuation of an existing one, with traders looking for confirmation such as increased trading volume to validate the breakout.
In this example, we see how, after the formation of an ascending triangle, the price broke through its upper line and after a retest of the level it rapidly went upward.
An example of an ascending triangle chart pattern breakout
How to Confirm an Ascending Triangle Breakout (Volume's Role)
Volume plays a crucial role in confirming breakouts by validating the strength of the price movement. A breakout with high trading volume suggests strong participation from market members, increasing the likelihood of the breakout's validity.
Meanwhile, a breakout with low volume may be less reliable and prone to false signals, as it indicates limited market interest and a potential lack of trust among traders. Therefore, traders often look for high volume to confirm breakouts and increase their confidence in taking positions based on the price movement.
Target Price and Risk Management
After a bullish breakout from an ascending triangle, traders often measure a potential target price by taking the height of the triangle and adding it to the breakout point. This method assumes that the upward momentum will continue, projecting a price target based on the pattern's previous range.
Regarding the distance between the triangle's height (the difference between the upper trendline and the lower trendline)
Traders estimate a target price for an uptrend after a bullish bias from an ascending triangle chart pattern by projecting the distance between the triangle's height upwards from the breakout point. This method considers that the upward momentum will continue, aiming to reach a price target equal to the triangle's height plus the breakout point.
The possibility of false breakouts above the upper trendline
False breakouts above the upper trendline of an ascending triangle happen when the price breaks through the resistance level but fails to sustain the upward momentum, falling back into the pattern. These false breakouts can mislead traders into believing a new uptrend is forming, leading to early buy orders that may result in losses when the price retreats. Low trading volumes, market manipulation, or sudden changes in market sentiment are common factors that cause the frequency of false breakouts. Traders often look for confirmation through additional indicators, like as volume spikes or repeated candlestick closes above the trendline, in order to minimize the risk.
Useful recommendations:
It is recommended to use confirmation signals like volume and other technical indicators to strengthen the bullish bias signal from the ascending triangle.
Basic trading techniques like stop loss and take profit levels are useful for risk management while using a triangle to trade cryptocurrencies. The levels are determined by the triangle pattern that is currently in place as well as your trading plan, which may involve making a trade after or predicting a breakout.
For example:
- Ascending triangle patterns are among the most popular chart indicators used by traders, but they do not always predict growth. For a conservative strategy on an ascending triangle, the stop loss level is set behind the oblique line. The take profit level is determined by the trader independently, based on his risk management strategy.
- For an advanced strategy on an ascending triangle the position will be entered not on a breakout, but on a return from the oblique line. The stop loss level is also set behind the oblique line, and the take profit level can be set either at the intersection of the price candle and the upper side of the triangle or at a higher level, based on the risk management strategy.
Variations of the Breakout and Related Patterns of Ascending Triangles
Breakouts of an ascending triangle can vary in several ways.
A breakout with a pullback occurs when the price moves above the upper trendline and then briefly retraces back to the breakout point before continuing upward, confirming the breakout's validity.
A breakout with a reset happens when the price moves above the trendline but then falls back below it, creating a new consolidation phase before potentially breaking out again.
And a breakout with a double bottom involves the price initially breaking out, then retracing to form a double bottom pattern near the breakout level, which often signals a stronger potential for a sustained upward move once the double bottom is confirmed.
Ascending, symmetrical or descending triangles?
Ascending triangles feature a flat upper trendline and a rising lower trendline, indicating bullish momentum as buyers consistently push the price higher. In contrast, symmetrical triangles have converging trendlines, with neither side being dominant, resulting in a pattern that lacks directional bias and can break out either up or down. Descending triangles, however, have a flat lower trendline and a descending upper trendline, suggesting bearish sentiment as sellers repeatedly drive the price lower. Each pattern reflects different market dynamics and potential future price movements. Think wisely before choosing and make a good technical analysis to gain good profits and avoid losses.
Conclusion
The ascending triangle is one of the basic patterns found in cryptocurrencies and stock charts. It’s quite a useful technical analysis tool mostly used by traders to identify potential bullish continuation signals. Here the horizontal resistance line signifies a key level where sellers step in, and the ascending trendline demonstrates increasing buying pressure. So when the price breaks above the resistance line, it often signals a strong buying opportunity, as the upward momentum is likely to continue.
Traders value ascending triangles for their ability to provide clear entry and exit points. However, it's essential for traders to confirm breakouts with additional indicators or volume analysis to reduce the risk of false signals. Understanding the broader market context and being aware of potential news can enhance the effectiveness of this pattern.
In conclusion, the ascending triangle is a valuable pattern for predicting bullish market behaviour. Its clear structure provides trend information useful for traders. However, like all trading strategies, it should be used with other analytical tools and market knowledge to maximize its predictable effectiveness.
FAQ
Is an ascending triangle bullish?
Yes, an ascending triangle is typically considered bullish.
What are the key visual features that help identify an ascending triangle on a crypto chart?
The key visual features of an ascending triangle on a crypto chart are a rising lower trendline and a horizontal upper trendline, forming a triangle shape.
What role does volume play in confirming a breakout from an ascending triangle?
Volume can confirm a breakout from an ascending triangle by showing increased trading activity accompanying the breakout.
Can an ascending triangle form during an uptrend, downtrend, or sideways movement?
An ascending triangle can form during an uptrend, downtrend, or sideways movement, but it's often seen as a bullish continuation pattern when occurring in an uptrend.
Disclaimer: Includes third-party opinions. No financial advice.


