On This Page
- Triangle chart patterns
- What is a triangle chart pattern?
- Types of triangle chart patterns
- How to trade triangle chart patterns
- Are Triangle Patterns Bullish or Bearish?
- Three main types of triangle patterns in detail
- What are the advantages of the Triangle Pattern?
- What are the disadvantages of the Triangle Pattern?
- Risk Management and Considerations
- Conclusion
- FAQ
Triangle chart patterns
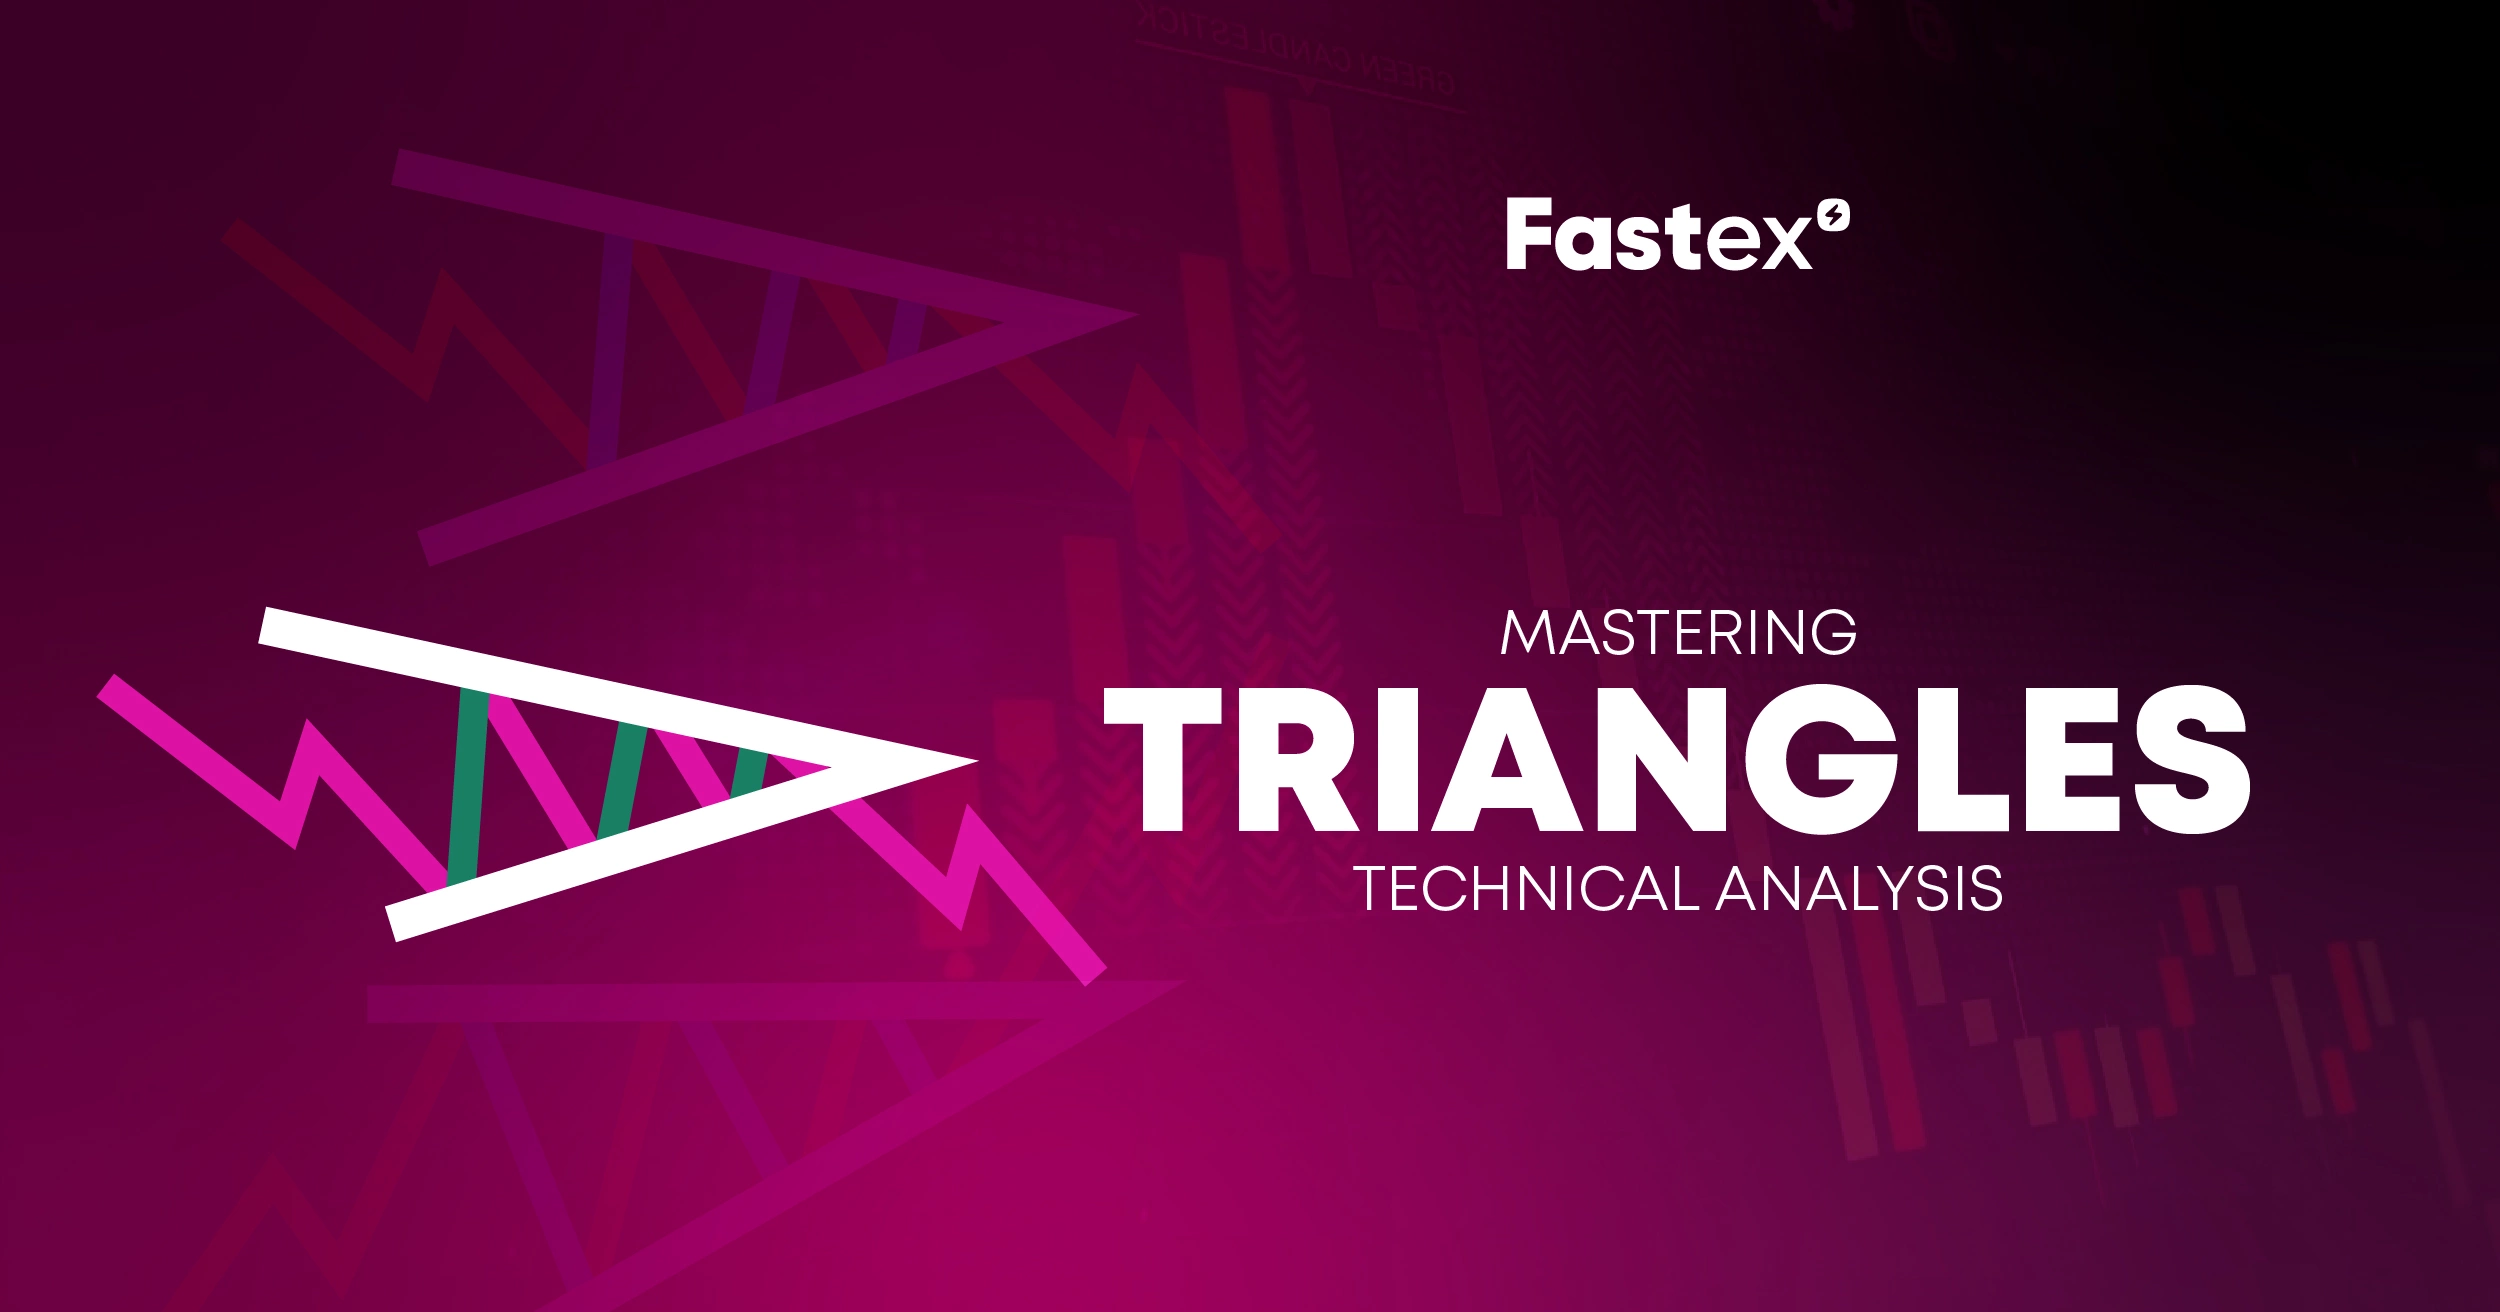
Triangle chart patterns are a popular and important type of pattern used in technical analysis to guess how the prices of assets in the financial markets will move in the future. The price of an object converges over time, making a triangle shape on a price chart. When the lights "stand up" in a way that makes a geometric shape when the two ends are joined, you can see a pattern.
In technical analysis, patterns in triangles are used to look for signs of price changes, shifts in trends, or evidence of trends.
Important: The numbers in the technical analysis only show possibilities. They don't show the future and can't exactly tell where the price will go. Risk control and the right strategy are the most important things, while the statistics are just a bonus.
What is a triangle chart pattern?
Trading and investing are two areas that make use of the triangle chart pattern as a tool for technical analysis. This pattern is used to forecast potential price movements by analyzing the shape that is generated by the price action on a chart. Generally speaking, it indicates that the price is going through a period of consolidation before breaking out in a new direction.
The triangle chart pattern lets traders see the current market trend visually, guess how prices will change, and find the best times to enter and leave the market. There are different time frames where the triangle pattern can be seen. The more time frames that are used, the more accurate the price predictions will be.
The triangle can go down, up, or be symmetrical. Which triangle you see determines how likely it is that a price will go up or down:
Triangle patterns in trading come in three basic varieties: ascending, descending, and symmetrical. A horizontal upper trendline and a rising lower trendline define an ascending triangle and suggest a possible bullish continuation. A falling triangle indicates a possible bearish continuation with its horizontal lower trendline and declining upper trendline. Convergent upper and lower trendlines of a symmetrical triangle point to a possible breakout in either direction.
Traders use these patterns in triangles to guess how prices will move in the future and make smart choices. These patterns help analysts spot possible breakouts and reversals, which helps them make smart trade decisions. To do well in the financial markets, it's recommended to understand and recognize trends.
How is a triangle pattern made?
The pattern is made up of two trendlines that get closer together. One trendline links a sequence of lower highs and another to a series of higher lows. The trading range gets smaller as these lines converge, showing less price volatility. Triangle patterns can develop over several months or just a few weeks. When the pattern takes longer to develop and is followed by a notable price movement following triangle chart pattern breakout, it is seen as more dependable. Traders often forecast that distance from the breakout point by measuring the height of the triangle at its broadest point, therefore estimating the possible price movement following the breakout. This helps to define trade target prices.
Does triangle pattern volume go up or down?
Usually, as the pattern grows, the volume goes down. The drop in volume shows that traders aren't sure what they're doing, which usually leads to a time of consolidation. As soon as the price breaks out of the triangle pattern, the volume generally starts to rise again.
Types of triangle chart patterns
There are three basic types of triangles. Every kind has its specific strategy:
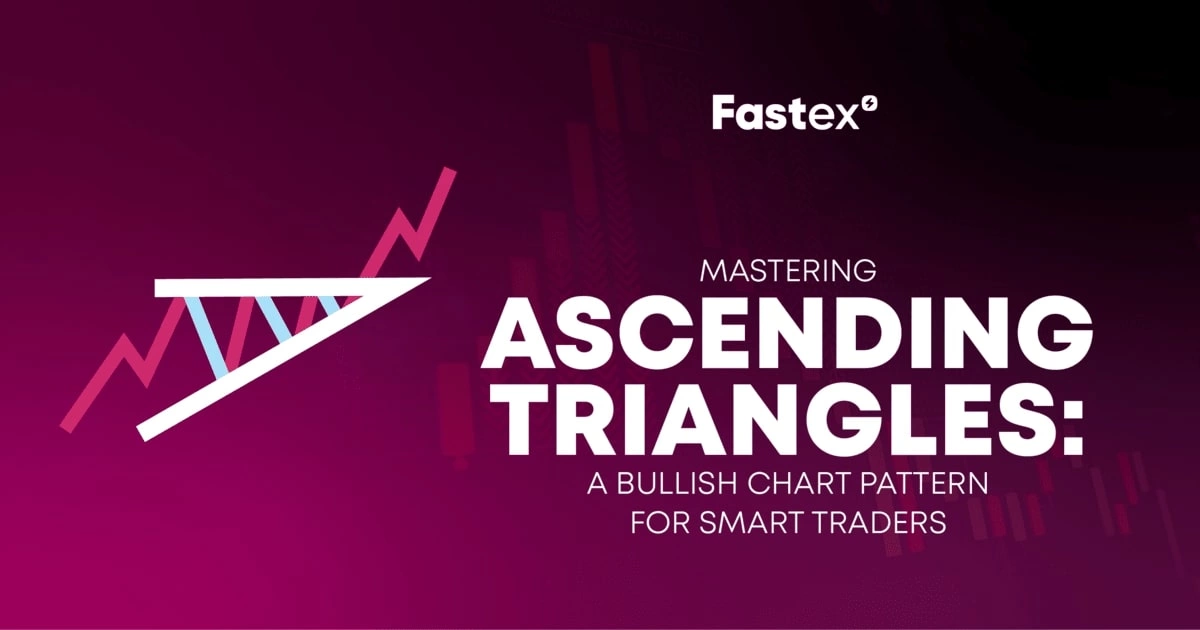
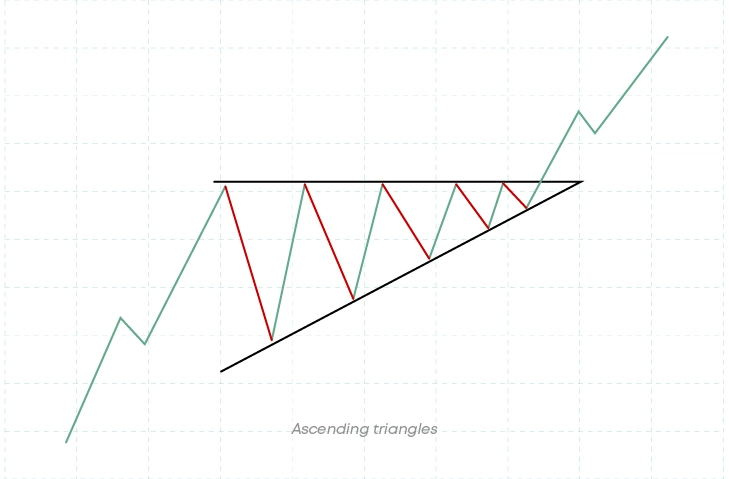
• The Ascending triangle has a straight side on top and an angled side on the bottom. The sharp angle on the bottom faces upward. If you see an ascending triangle, it means that the price is pushing up against the red line, which is a level of resistance. The more the price attempts this level, the more likely it is that it will break through.
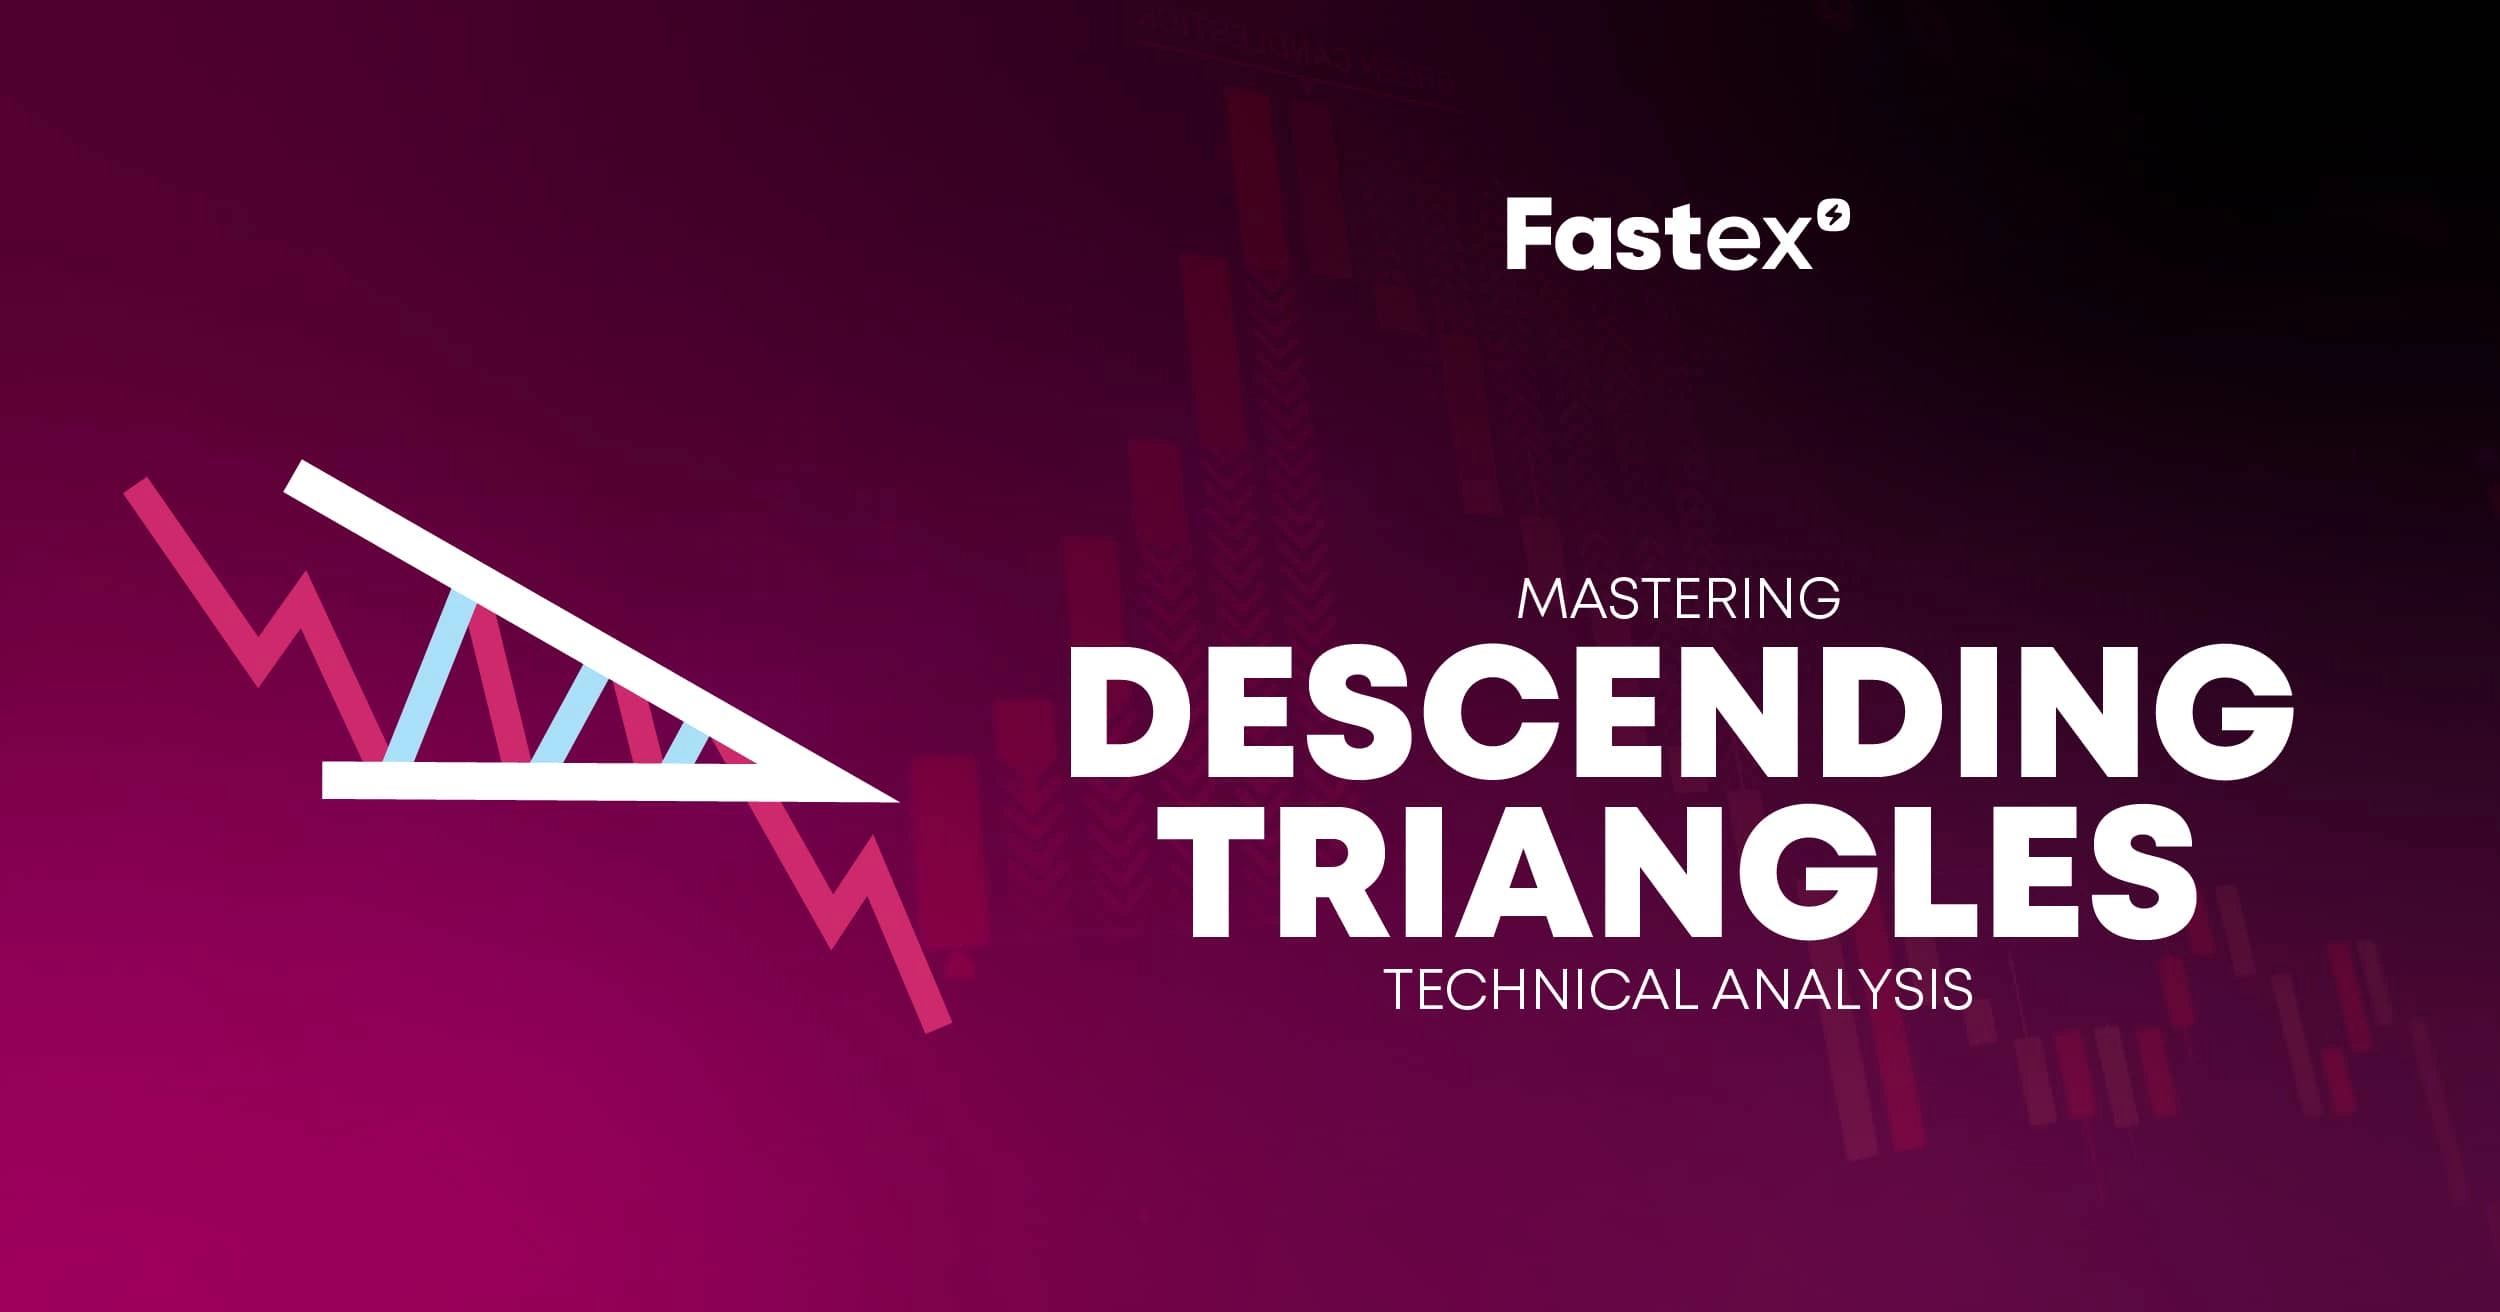
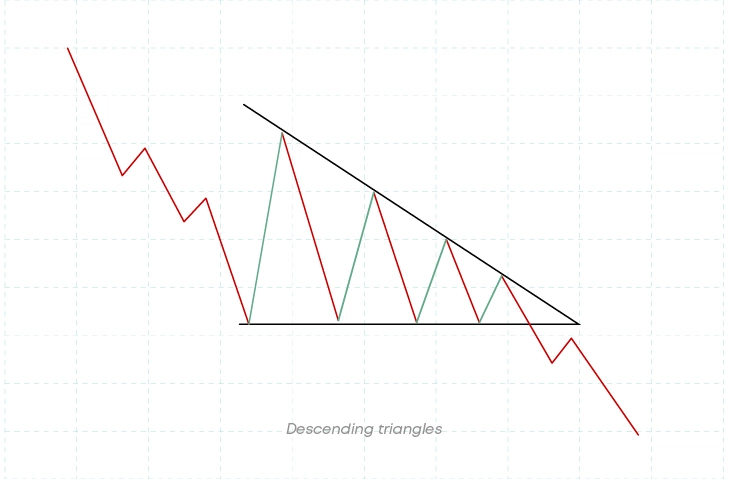
• Descending triangle. The top of a descending triangle is angled, and the bottom is straight. The sharp angle on the bottom faces downward.
If an asset's price falls inside a descending triangle, and it breaks through the bottom side, there is usually a sharp price drop:
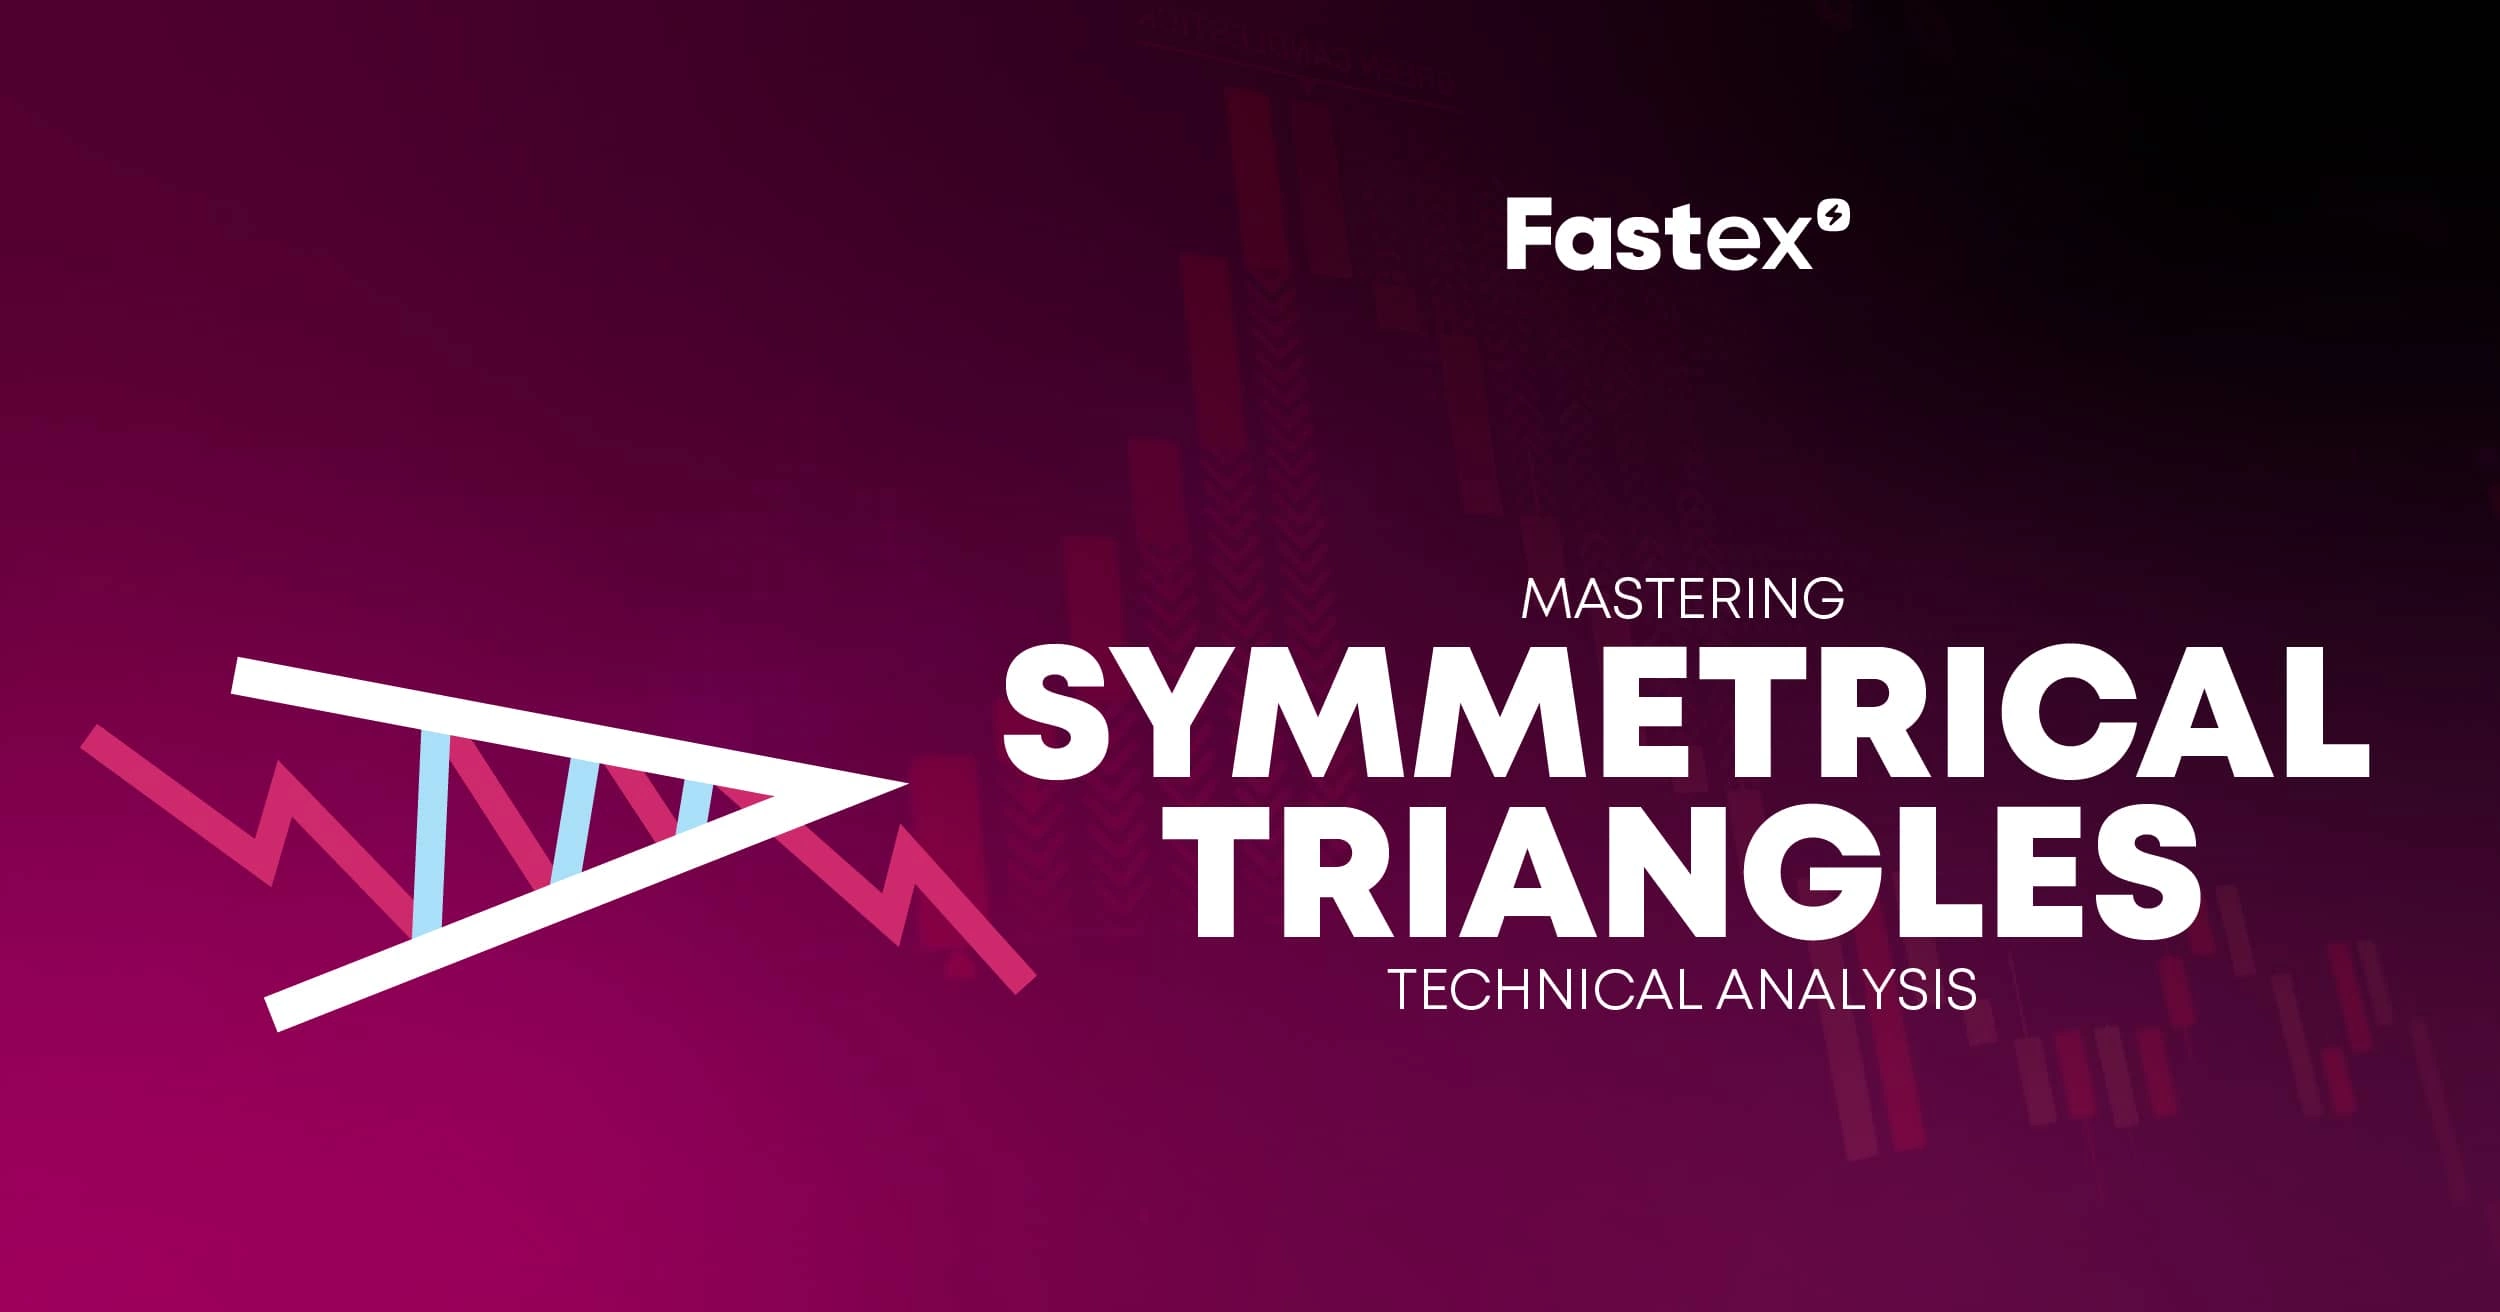
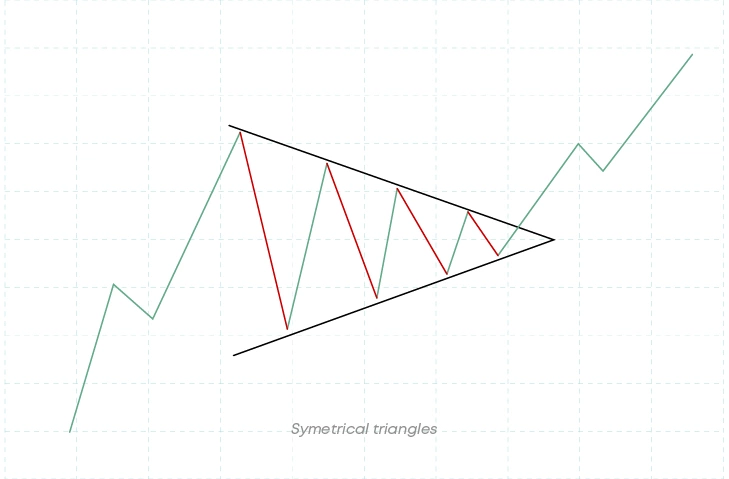
• Symmetrical triangle. A standard symmetrical triangle gets smaller over time, and its acute angle faces right. When this pattern appears, it means that both bulls and bears are equally strong and that volatility is going down.

How to trade triangle chart patterns
Before trading triangle chart patterns, traders need to find the pattern using trendlines that come together at the peaks and dips.
Keep an eye on the volume, which tends to go down during setup and up during triangle chart pattern breakout. A clear close above the trendline and higher volume will confirm the rise. If the move is going up, you should go long, and if it's going down, you should go short.
Use stop-loss orders to control risk, and figure out your profit goals by guessing how high the triangle will get from the point where it breaks out. Keep an eye on the stops and change them as needed to lock in profits when the price goes up. Using triangle patterns in trading to make smart decisions is easier with this methodical technique.
Traders should pay extra attention to candles that break through the angled side because it could mean that the market is changing. In a symmetrical triangle, a breakout can happen in any direction, starting a new trend after a long period of sideways movement.
Using trading triangle patterns to make smart choices means carefully finding the pattern, making sure the breakout happens, and managing risk well.
Are Triangle Patterns Bullish or Bearish?
Triangle patterns can go either up or down, based on the type of triangle and the way the price breaks out:
- An ascending triangle is usually seen as a sign of a bullish trend. It has an upper trendline that is flat and a lower trendline that is rising. This trend shows that buyers are getting stronger, and the price is likely to break out to the upside.
- The descending triangle is usually seen as a sign of a bearish trend. It has a top trendline that goes down and a horizontal lower trendline. This trend shows that sellers are taking over, so the price is likely to break out to the downside.
- The symmetrical triangle can go up or down, either up or down. It has trendlines that are coming together, and there is no clear bias in either way. If the breakout goes up or down, that tells you whether it is bullish or bearish. The trend that came before often gives a hint about the likely breakout.
In short, the ascending triangles are bullish triangle chart patterns, the descending triangles are bearish, and the symmetrical triangles can go either way, based on the direction of the triangle chart pattern breakout.
Three main types of triangle patterns in detail.
Ascending Triangle
An ascending triangle is a bullish triangle chart pattern with a horizontal level of support and a rising trendline that links higher lows. This pattern usually means that a rise will continue. It shows that buyers are getting more aggressive as the price settles near resistance.
Traders can spot a rising triangle by seeing several peaks (resistance) that are all close to the same price level and rising troughs (support). As the pattern changes, trade volume often goes down, which means that buyers and sellers are in a temporary balance.
The price breaks out of an ascending triangle when it hits the horizontal resistance level. This is usually followed by a rise in trading volume, which confirms that the price could go up even more. Traders often open long positions on the confirmation of the breakout, hoping to make money from the expected continuing of the uptrend.
Stop-loss orders are put in place below the most recent higher low or the rising trendline so that traders can manage their risk. A common way to set profit goals is to find the triangle's highest point at its biggest point and then project that distance upward from the breakout point.
How can you trade ascending triangles?
A rising triangle is valuable for traders because it gives them clear entry and exit points. It is a bullish triangle chart pattern that shows that buyers are getting stronger and that the price may go up. Traders can make smart trading choices with this pattern if they understand its structure, volume patterns, and breakout confirmation.
To spot possible breakouts and price moves up, it's important to be able to spot rising triangles. Moreover, traders must confirm breakouts with extra signs or volume analysis to lower the chance of getting false signals. Knowing about the bigger picture of the market and possible news can make this trend work better.
You can use the ascending triangle to figure out when the market will go up. Its clear framework gives traders useful information about trends. But, as with any trading strategy, it should be used with other analytical tools and knowledge of the market to get the most out of how well it works.
Descending Triangle
A descending triangle is a bearish triangle chart pattern on a chart that is used in technical analysis. It has a horizontal support line and a trendline that goes down from lower highs to lower lows. The trend shows that there is more pressure to sell as buyers can't keep up with higher prices.
A descending triangle happens when prices make lower highs that line up with a falling trendline and lows that are close to a horizontal support line. Each rise is weaker than the last, and the support level is tested over and over but holds. This pattern shows that there is more and more pressure to sell. When the price breaks below the horizontal support line, it proves that the trend is down.
A descending triangle is often a sign that sellers are slowly taking over. Traders and experts use this pattern to find times to sell and expectations for how prices might move after the support line is broken.
How can we trade descending triangles?
A horizontal support line and a downward trendline connecting lower highs make up a descending triangle pattern on a price chart. As buyers try to hold on to higher prices, this shape points to a situation in which sellers are slowly taking over.
Traders usually wait for a clear break below the horizontal support line before they can trade. This breakout should ideally be followed by more trades, which shows that the downward move is likely to continue. To avoid false signs, it is important to confirm the breakout.
Once traders are sure that the breakout happened, they often think about going short. This means selling the item with the hope that the price will keep going down. Some traders may wait for a repeat of the support line that was broken before getting in on the trade. They see this as proof that the new level of resistance is real.
It's important to keep a close eye on the price action during the trade and change your stop-loss levels as needed to protect your gains as the price moves in the way you expect it to. By using these tactics, traders hope to make money off of the market's descending triangle patterns, which show that prices are going down.
Symmetrical Triangle
A symmetrical triangle is a type of chart pattern made up of trendlines that come together. One line connects a set of lower highs, and the other line connects a set of higher lows. This makes a triangle form, which means that the market is currently stable but uncertain.
Traders see a drop in trade volume when a symmetrical triangle forms. This means that there are an equal number of buyers and sellers as the price moves between levels of support and resistance.
A clear move above or below the lower trendline is usually a sign that the price has broken out of a symmetrical triangle. The breakout can happen in either way. During the breakout, volume often goes up, which confirms that the trend has ended.
How can we trade symmetrical triangles?
In order to trade symmetrical triangles, it's needed to spot a pattern on a price chart made up of trendlines that are coming together, with one connecting lower highs and the other higher lows. Usually, this pattern means that the market won't be able to decide what to do next and could be volatile.
The first thing traders do is look for trendlines that are coming together and notice that trade volume is going down while the triangle is made. Buyers and sellers are keeping their places equal, which shows that there isn't a clear direction.
Continuous tracking is important in the trade. When the price goes up, traders change their stop-loss levels to protect their profits. They use trail stops to make the most of their gains while still letting the price go up even more.
By understanding how symmetrical triangles work and waiting carefully for confirmation of breakouts, traders can take advantage of the market opportunities that these patterns in triangles can bring up.
Managing the risks is very important when dealing with symmetrical triangles. Stop-loss orders are usually placed on the other side of the triangle from the breaking point so that traders don't lose too much money if the price suddenly turns around.
What are the advantages of the Triangle Pattern?
Whether ascending, descending, or symmetric, the triangle pattern has various benefits for financial markets researchers and traders:
- Easy Recognition of Patterns: Triangle patterns stand out on price charts, which makes them easier to spot than some other technical patterns. Traders can quickly spot these patterns and guess how prices might move in the future.
- Predictive Nature: This ability to predict the future lets traders guess the direction of the market and set their positions appropriately.
- Managing risk: Trading triangles make it easy to plan how to handle risk. Traders can set stop-loss orders just outside the pattern's edges, above the upper trendline for bullish patterns and below the lower trendline for bearish triangle chart patterns. This helps them limit their losses if the trade doesn't go as planned.
- Volume Confirmation: As traders look at both price action and volume, they can figure out how the market feels and how likely it is that prices will keep moving in the breakout direction.
Additionally, triangle patterns in trading provide a structured way to look at price changes and make smart trading choices. These techniques help traders find and profit from market trends by combining pattern recognition with risk management and goal-setting.
What are the disadvantages of the Triangle Pattern?
Along with many benefits, the triangle pattern has several disadvantages for traders:
- False breakouts: One of the main problems with this pattern is that it can lead to false breaks. Sometimes, the price will briefly go outside the pattern (above or below the upper trendline), but it will quickly move back inside the pattern. This means that traders who start positions too soon based on the breakout could lose money.Unreliable volume signals: Sometimes the volume signals can be wrong. If traders only use volume proof, false breakouts with high volume or low volume can be confusing.
- Market changes: If the market is moving quickly or is very unpredictable, triangle patterns might not always be a good sign. Outside events, like news stories or changes in the economy as a whole, can cancel out technical signs, making price changes hard to predict.
- Time-consuming pattern development: Triangle patterns require time to fully develop and confirm. Traders must exercise patience while waiting for the pattern to reach maturity and for the breakout to occur, which may not always align with short-term trading triangles strategies.
- Limited Profit Potential: Even though triangle patterns can show that trends will continue, they don't always cause big price changes. If a trader is looking to make a lot of money based only on the pattern's height projection, the price may not move as much as it is thought.
By knowing these issues, traders can lower the risks that come with triangle patterns and use more analysis and confirmation methods to make better trading decisions.
Risk Management and Considerations
Managing your risks is very important when trading triangle patterns to keep your losses to a minimum and get the best trading results. An important part of managing risks well is making sure they are properly identified and confirmed. It is very important to make sure that the triangle pattern is properly identified by drawing clear trendlines from the highs to the lows.
Avoiding trades that are made too quickly based on trends that aren't clear or aren't complete can help lower risks.
It's important to wait for proof of the breakout beyond the pattern's edges, whether that's the upper resistance line or the lower support line. A lot of the time, higher volume after a breakout confirms that the move was strong and keeps false breakouts from happening.
It is also vital to keep an eye on the trade and the market at all times so that stop-loss levels and profit goals can be changed as the trade changes. This helps protect wins and lower the chance of losses.
Using these risk management tips can help you improve your trading plan for triangle patterns, keep your money safe, and make your trading more consistent and long-lasting.
Conclusion
To conclude, traders can make better trading choices and predict possible breakouts if they understand triangle patterns. But, as with all technical analysis tools, these should be used with other indicators and analysis methods to make sure that possible price changes are real.
Ascending, falling, and symmetrical triangles are all types of triangle chart patterns that are very useful for traders because they help them spot times when prices are stable and predict how they will move in the future. These trends make it easy for traders to see when a breakout might happen, so they can choose when to enter and leave the market. To use triangle patterns effectively, you need to be able to spot them correctly, confirm breakouts, and be disciplined about managing risk so that you can avoid false signs and market volatility.
Market trends can be used by traders to make profits by using the right methods to guess what will happen. Setting realistic profit goals and stop-loss levels strategically can help traders manage risk and get the best returns. Pattern recognition and false breakouts can be helpful, but it's important to remember that they are biased.
Using triangle patterns as part of a larger trading plan, along with constant monitoring and focus, can improve trade results and consistency. By understanding and using these trends, traders can find their way through the complicated financial markets in a structured way.
FAQ
How reliable are triangle patterns?
Overall, triangle patterns are reliable, though their chances of succeeding depend on the type of triangle and the market.
Is a triangle pattern bullish?
Depending on the type of triangle pattern and the way the price breaks out, it can be either bullish or bearish.
What are the different Types of Triangle Chart Patterns?
Triangles come in three main types: symmetrical, ascending, and descending.
How to calculate the potential price target for a Triangle pattern?
Figure out the triangle's largest point's height. Then, add or take away this distance from the breakout point depending on whether the breakout is going up or down.
Does a triangle pattern always guarantee a successful breakout?
No, triangle patterns don't always mean a good breakout; sometimes they lead to false breakouts.
How can you manage risk when trading based on triangle breakouts?
Maintain risk by using stop-loss orders and stock sizing. To limit possible losses and make sure the size of your trade matches your risk tolerance, put stop-loss orders just outside the other side of the triangle.
Disclaimer: Includes third-party opinions. No financial advice.


