What are symmetrical triangles?
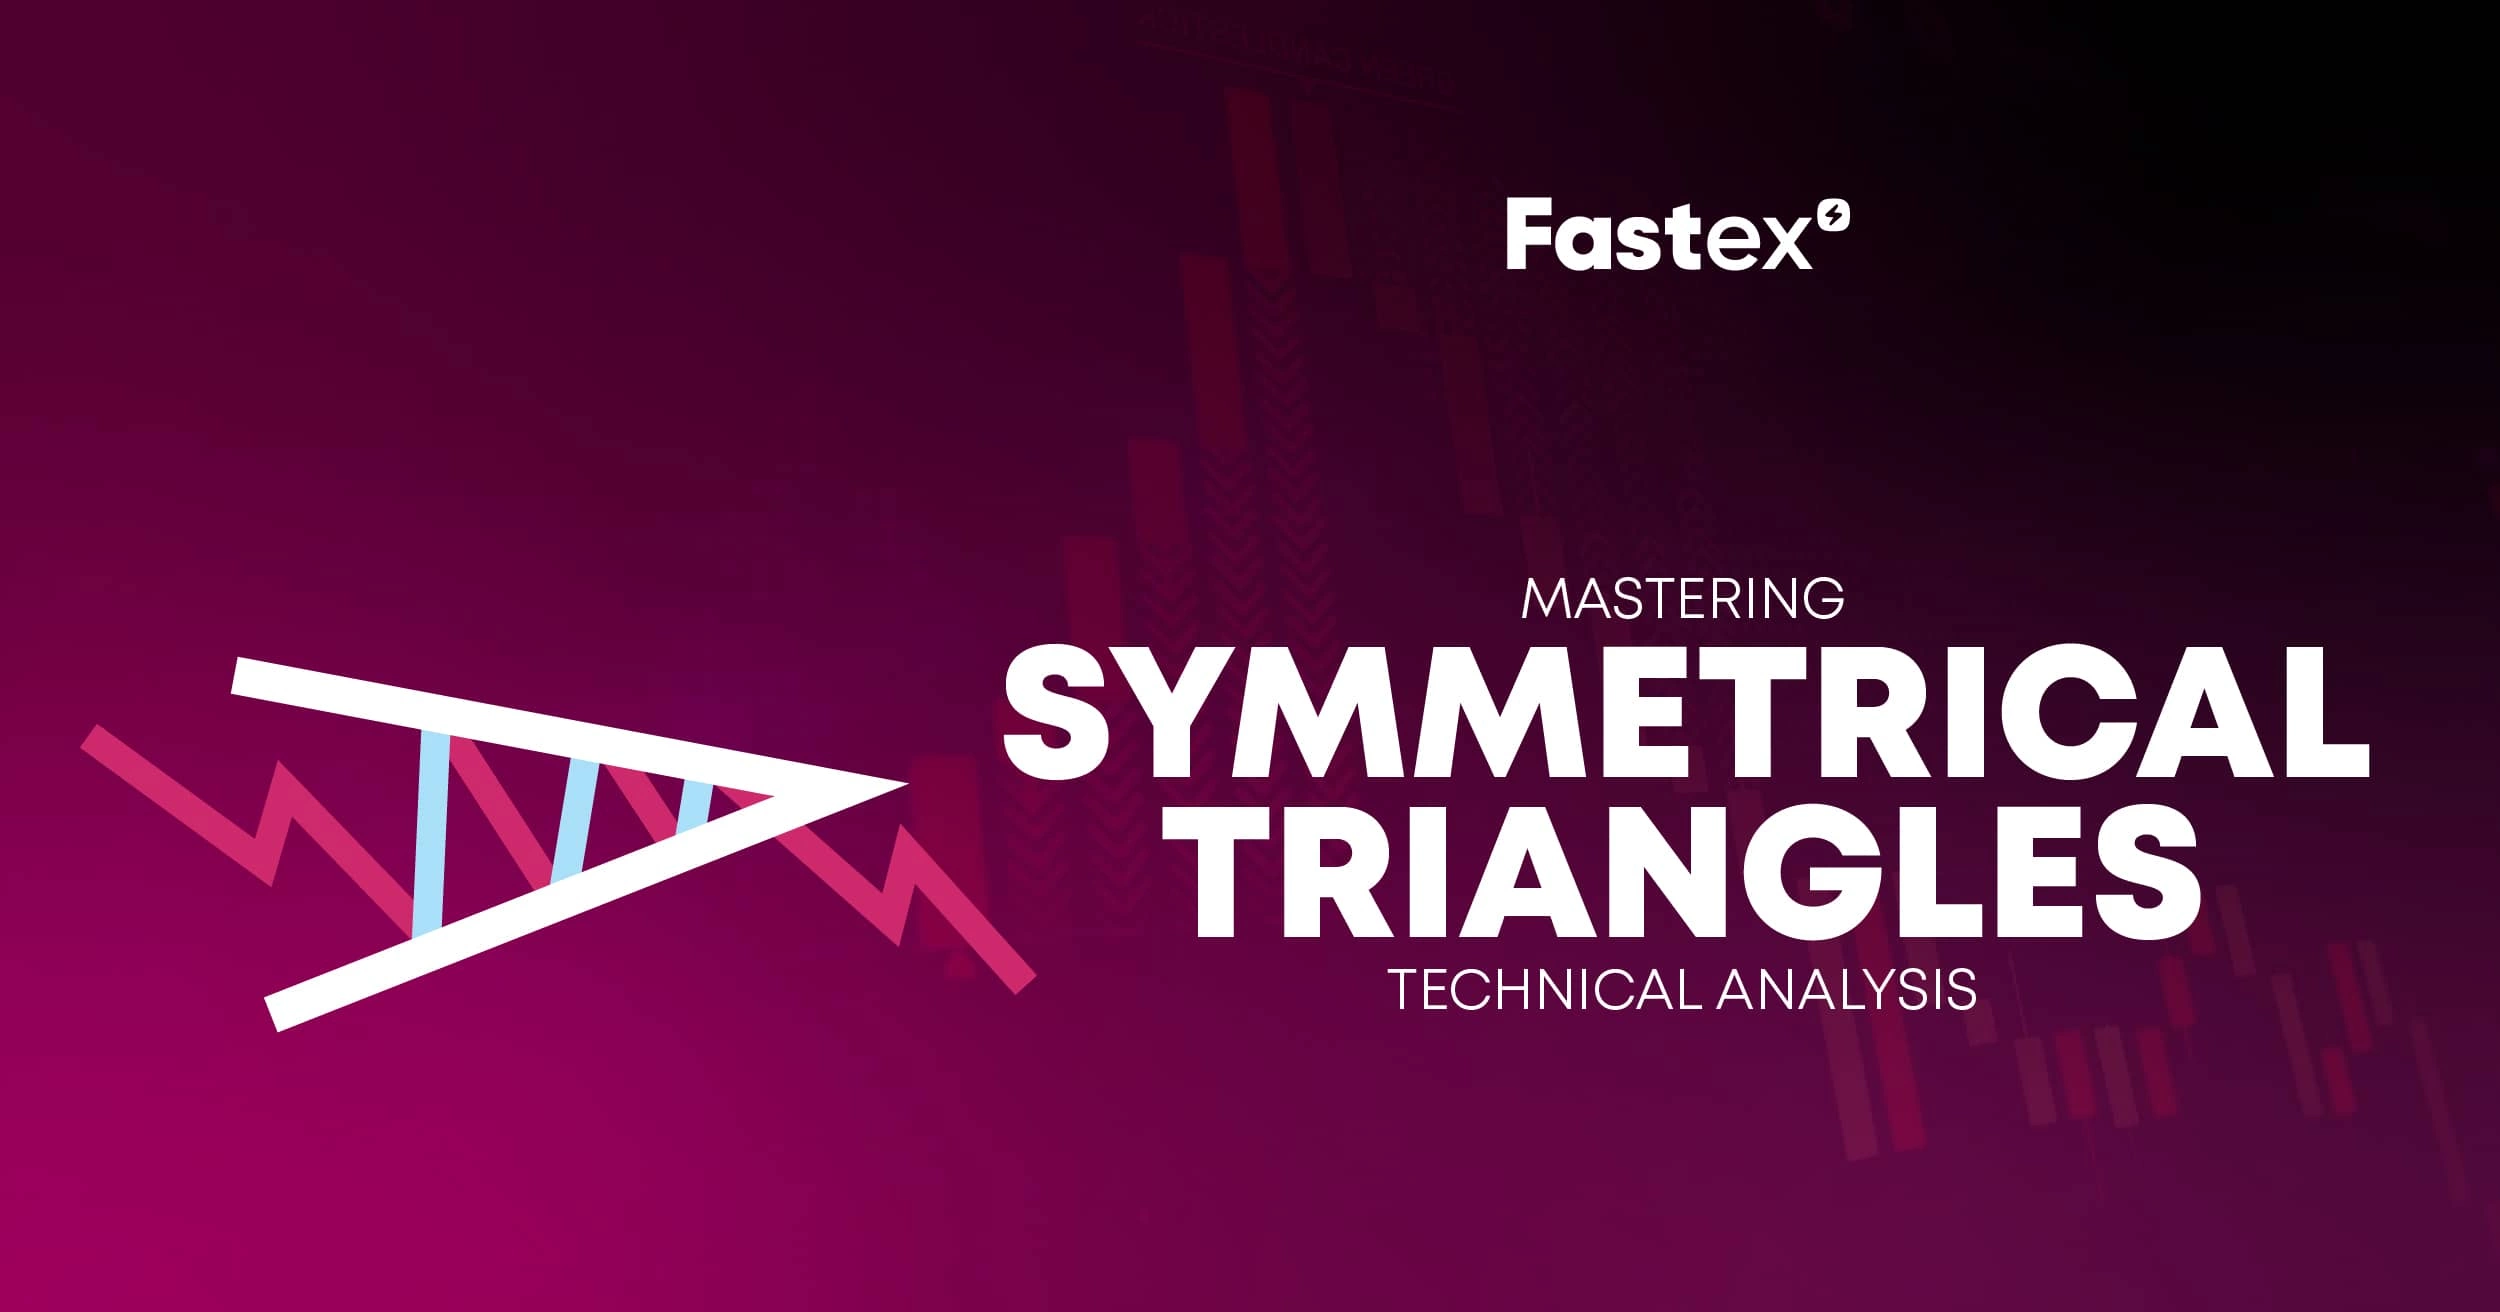
Symmetrical triangles are a specific type of continuation pattern within the triangle pattern category in technical analysis. These patterns appear when the price flows inside the trendlines that run in the direction of one another, forming a triangle-like structure.
This pattern suggests that buyers and sellers are in balance, which lowers volatility and narrows price movement. So that, when there is an equal number of buyers and sellers, the price narrows and becomes calmer over time.
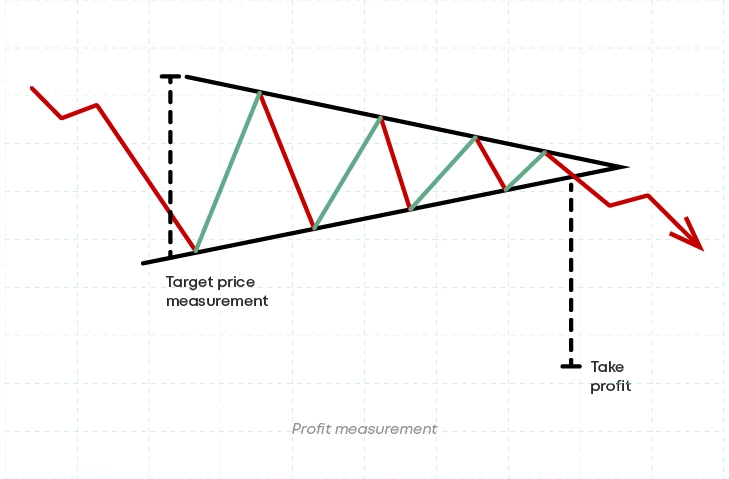
Volume often declines as the pattern develops and rises during the breakout. Here it indicates the potential future direction of the price and can move in any direction. The height of the triangle is frequently used by traders to predict how far the price might move as they search for these breakouts to choose when to buy or sell.
Accordingly, traders employ symmetrical triangle patterns to identify probable breakout points and price targets based on their height.
You may also be interested in:
Ascending Triangle Chart Patterns
Descending Triangle Chart patterns.
How to Recognize Symmetrical Triangle?
It's essential to recognize symmetrical triangle patterns in order to spot possible breakouts as well as trend continuations or reversals. These patterns usually precede big price moves by signalling the time of market hesitancy. By identifying a symmetrical triangle chart pattern traders can get ready for a breakout, which usually happens with higher volume and signals a significant move. Here the traders can predict whether the current trend will continue or reverse by looking at the symmetrical triangle pattern breakout direction, which can be either upward or downward. Symmetrical triangle pattern therefore provide insightful information that may be used to make wise trading decisions and profit from upcoming price changes.
Formation and Characteristics of Symmetrical Triangles
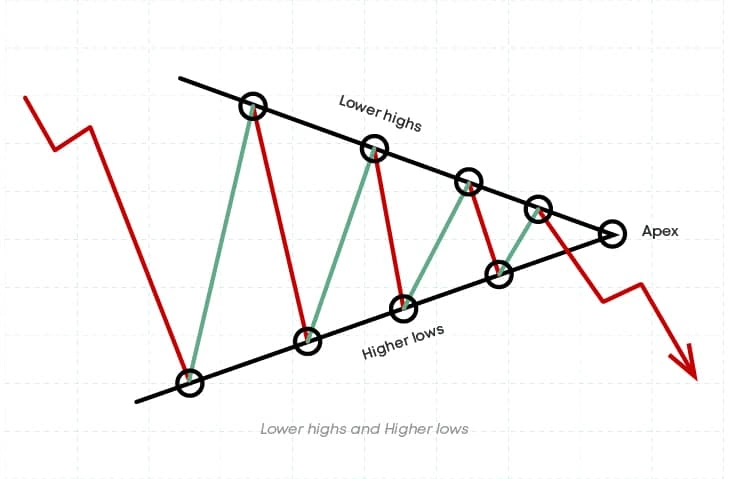
On a price chart, a symmetrical triangle is represented by two lines joining to form a triangle. The upper trendline, or top line, joins a sequence of peaks when the price has regularly hit lower highs. The lower trendline, also known as the bottom line, joins a sequence of troughs where the price has consistently hit higher lows. As they move closer together, these lines create a triangle with an apex moving right. This form indicates that the price is starting to narrow and may soon break out in any direction.
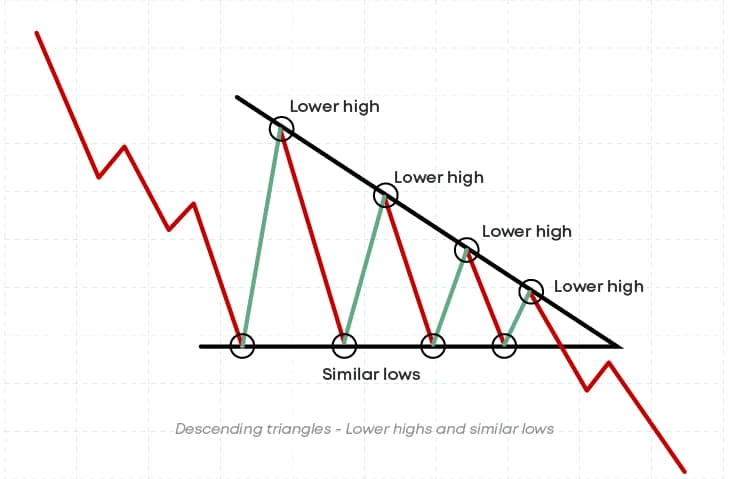
The top trendline connects the locations where the price reaches lower highs and falls downward. The lower trendline connects the locations where the price hits higher lows with an upward slope. A symmetrical pattern pointing to a central apex is produced by these lines meeting each other. When the pattern is complete, this symmetry typically indicates that there will be a large price change because it illustrates a balance between buyers and sellers. The price may break out in either direction after the pattern is complete.
Interpretation and Trading Signals
The symmetrical triangle pattern is formed as the price range narrows as it moves between lower highs and higher lows. In symmetrical triangles there are little fluctuations in the price, but nothing significant. Because of the equal match and lack of confidence between buyers and sellers, symmetrical triangles indicate a phase of stability.
This suggests that neither side is powerful enough to move the price in an obvious way. In other words, neither traders nor buyers have enough power to influence the price to their advantage. This is further supported by the triangle's declining volume, which indicates a decline in trading activity and a lack of conviction on either side. As the market gathers momentum for a big move, this phase of hesitation typically comes before a notable breakout. Less trading activity within the triangle suggests that the market is taking a rest and is waiting for something to happen. When the triangle ends, this frequently results in a significant change in price.
Do the Breakouts Signal a Continuation of the Previous Trend?
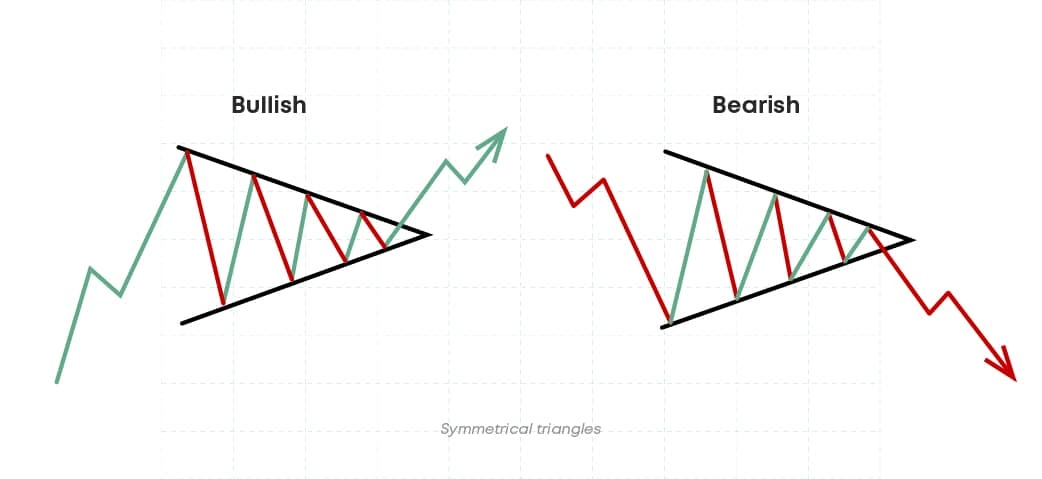
Bullish and bearish symmetrical triangle chart patterns have significant effects on traders, depending on whether the breakout occurs above or below the upper or lower trendline.
A bullish breakout, occurring above the upper trendline, signals a potential continuation of the previous uptrend. This case suggests that buyers have gained control, resulting in a higher buying activity, potentially driving the price.
On the other hand, a bearish breakout that occurs below the lower trendline signals a possible continuation of a downtrend. A symmetrical triangle pattern breakout shows that sellers have seized control, increasing selling pressure and lowering the price.
In both scenarios, the breakouts from the symmetrical triangle give traders distinct signals regarding the price direction going forward. So that they provide chances to enter trades in the right direction. Also, breakouts frequently happen with higher trading volume, which supports the signal's validity even more.
What is the Role of Volume in Confirming Breakouts?
Verifying breakouts from symmetrical triangles is mostly dependent on volume. High trading volume supports and validates a move when a breakout occurs, whether it is a bearish or bullish symmetrical triangle.
In the case of a bullish breakout, if volume grows dramatically as the price breaks above the upper trendline, it signals that traders are buying with confidence. This huge volume confirms its reliability and that the rising trend will likely continue. Meanwhile, in a bearish symmetrical triangle, an increase in trading volume when the price falls below the lower trendline confirms the strength of the move. On the other hand, a low volume may signal a lack of confidence among traders, putting doubt on the move's durability over time. In such situations, traders need to get more confirmation before taking action.
Overall, the volume serves as a confirming indicator, giving key information about the degree of force and reliability of breakout signals from symmetrical triangles. It helps traders in sorting between true and false signals, allowing them to make better trading decisions.
Breakout Direction and Limitations
The breakout direction refers to the direction in which the price goes after breaking out of a symmetrical triangle. It can move up (bullish breakout) or down (bearish breakout). Traders have to understand this since it helps them forecast price movements in the future. A bullish symmetrical triangle indicates that buyers have taken control, which is likely to lead to higher prices and maybe the start of an uptrend. The bearish one indicates that sellers are in control, implying that prices will fall and possibly continue the decline.
However, breakout trading involves threats. False ones occur when the price briefly moves beyond the trendlines before reversing, resulting in losses if traders act too fast. Breakouts do not always last, especially when there is low trading volume or weak market momentum, resulting in losses or rapid reversals.
Traders can mitigate these limitations by using other indicators or waiting for confirmation indications, such as greater volume following the breakout or a retest of its level, or the presence of other supporting chart patterns or trend indicators. So, while trading can be effective, traders should exercise caution and be aware of the threats.
Risk Management and Considerations
What are False Breakouts and Why Do They Occur?
In trading, false breakouts happen frequently when the price momentarily crosses over or below the trendlines of a symmetrical triangle.
A bullish false breakout occurs when the price rises above the top trendline, indicating a bullish trend, but it rapidly reverses back into the triangle as a result of either intense selling pressure or a lack of buying activity. Likewise, a bearish false breakout occurs when the price breaks below the lower trendline, signifying a downward trend, but it quickly moves back into the triangle, potentially as a result of traders covering short positions or sudden buying interest.
False breakouts can be caused by a variety of factors, including poor trading volume, market manipulation, or unplanned news occasions. Traders prevent fake ones by waiting for confirmation signals, which include more trading volume, a retest of the breakout level, or positive technical indicators, before taking any action. Although traders may find false ones annoying, they can be better managed by being aware of them and employing appropriate risk management strategies.
What confirmation signals do the traders use?
Traders can verify breakouts from symmetrical triangle patterns and lower the possibility of false signals by using confirmation signals like volume and other technical indicators.
- Volume Confirmation: Trading volume is one of the most popular confirmation indicators. A breakout with a big increase in volume indicates strong market involvement and conviction, which increases the likelihood of a genuine one. In contrast, low volume during a breakout may speak about a lack of interest, increasing the likelihood of a false one.
- Retest of Breakout Level: It is recommended to keep an eye out for a return to the key level if the price breaks it. It's a positive indication that it is real if it maintains steady and doesn't fall below.
- Chart Patterns: Other chart patterns that support the breakout direction can also be used by traders to find confirmation. A bullish reversal pattern, such as a double bottom, or a bullish continuation pattern, such as a flag or pennant, can, for instance, support a bullish action from a symmetrical triangle.
- Other Technical Indicators: The strength can be verified with the use of momentum indicators like as the Moving Average Convergence Divergence (MACD) or the Relative Strength Index (RSI). Moving averages and other trend-following indicators might offer additional confirmation of the path direction.
Anyway, it is important to remember that breakouts and trends do not always play out 100%, they only show probabilities.
Additional Attributes of Symmetrical Triangles
How Important is the Volatility in the Symmetrical Triangles?
In symmetrical triangles, volatility is the measure of how much prices change inside the pattern. Volatility typically reduces when the triangle forms and prices settle between convergent trendlines. This appears as a more limited range of prices, signifying unpredictability. However, following a breakout, prices make a strong move, frequently with significant trading volume, and volatility soars. By trading in the right direction, traders can benefit from this.
False breakouts and price reversals are among the risks associated with high volatility. In periods of consolidation, low volatility creates uncertainty, requiring waiting for confirmation indications and patience before trading. In volatile markets, traders can make better decisions by having a better understanding of the volatility in symmetrical triangles.
What is the Duration of Symmetrical Triangles?
In a matter of days, symmetrical triangles can form rapidly, or they can take weeks or months to form. Longer-term triangles show lengthy periods of hesitation with greater price movements, while short-term triangles imply momentary market situations with little price moves. Triangle duration is affected by a number of variables, including buying/selling pressures, trade volume, and market conditions. Since the properties of a triangle determine the breakout direction and future moves, traders can modify their techniques by keeping an eye on patterns over time. Knowing triangle duration gives traders insights into market passion and possible short- and long-term price fluctuations, which helps them use proper strategies and get profit.
Conclusion
Summarized, symmetrical triangles are important technical formations with rising trendlines and decreased volatility that indicate market consolidation and hesitation. They frequently precede significant price changes, and breakouts suggest possible trend continuations or reversals.
Observing directions, volume, and confirmation indications is how traders examine symmetrical triangles. Rising momentum is indicated by a bullish breakout, and lower pressure is indicated by a bearish one.
Here the breakouts are validated by high trading volume, and trade signals are boosted by confirmation indications such as retests of levels or supportive technical indicators.
Overall, symmetrical triangles reveal information about the mood of the market and potential price changes. Traders are able to seize chances and handle market swings with confidence when they comprehend their features, analyze breakouts, and apply confirmation strategies.
FAQ
Is the symmetrical triangle pattern bullish or bearish?
The direction of a symmetrical triangle pattern sets the possible trend direction; it does not necessarily suggest a bullish or bearish bias.
Does a symmetrical triangle always guarantee a breakout?
No, a symmetrical triangle does not always predict it; rather, it signals a phase of consolidation and remains unclear direction until it reveals itself.
How can I differentiate between a true breakout and a false one in a symmetrical triangle?
Look for confirmation cues, such as volume and a retest of the breakout level, to help you distinguish between a genuine and a fake one.
How can I manage risk when trading based on symmetrical triangles?
When trading symmetrical triangles, control risk by utilizing stop-loss orders, determining the size of your positions, and following risk management guidelines.
What are the key visual features that help identify a symmetrical triangle on a crypto chart?
On a cryptocurrency chart, a symmetrical triangle is characterized by converging trendlines that switch between lower and higher lows to form a triangle.
Disclaimer: Includes third-party opinions. No financial advice.


