
Descending Triangle Pattern
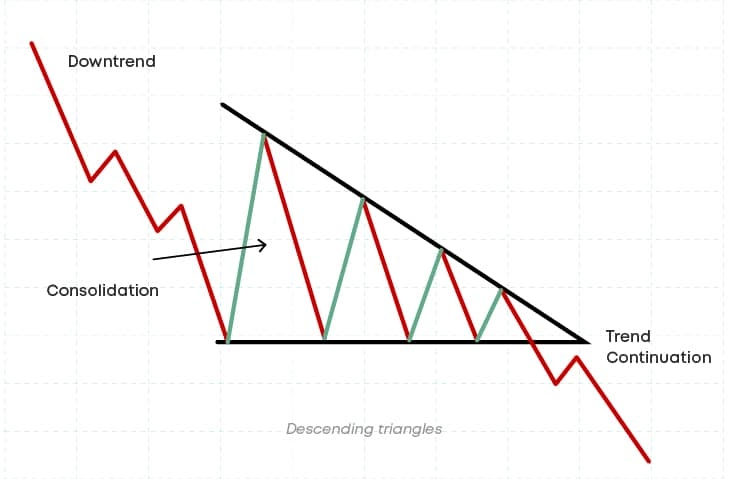
The “descending triangle” pattern is a figure of a “bearish” nature, usually formed in a downward trend. The pattern resembles a triangle with falling highs and a flat support line after a major downward movement and indicates a price decline.
After a breakout, the price is supposed to continue in the direction of the dominant trend, which is why descending triangles are mainly recognised as continuation patterns. On the other hand, in other cases, the formation may also appear in a bullish trend.
The importance of recognising descending triangles for identifying potential breakouts and downward price movements.
In technical analysis, a descending triangle pattern is an easily identifiable and simply recognized figure. This pattern is considered to be quite reliable for investments and carries low risks. Triangle pattern helps traders to have the ability to predict price changes, make informed decisions, manage risks, and make profits.
To build a figure, you'll need a distinct support line with at least two touches and a descending resistance line that forms the triangle's upper half. Because the top line is at a negative angle and the bottom line is horizontal, the resulting angle is to the right and downward.
Key Takeaways
- Descending triangles are bearish chart patterns. They are identified by a downward-sloping upper trendline and a flat or slightly upward-sloping lower trendline.
- A descending triangle pattern signals a potential continuation of a downtrend or the start of a new one. As sellers push prices lower, the support level weakens, creating lower highs along the upper trendline.
- Traders can use the triangle's height to estimate a target price after a bearish breakout. This is a basic approach, and technical indicators can be used for identifying price targets.
- Descending triangles are not foolproof indicators. False breakouts can occur, and traders should consider other market factors before making investment decisions.
What Does a Descending Triangle Look Like?
The visual features of a descending triangle
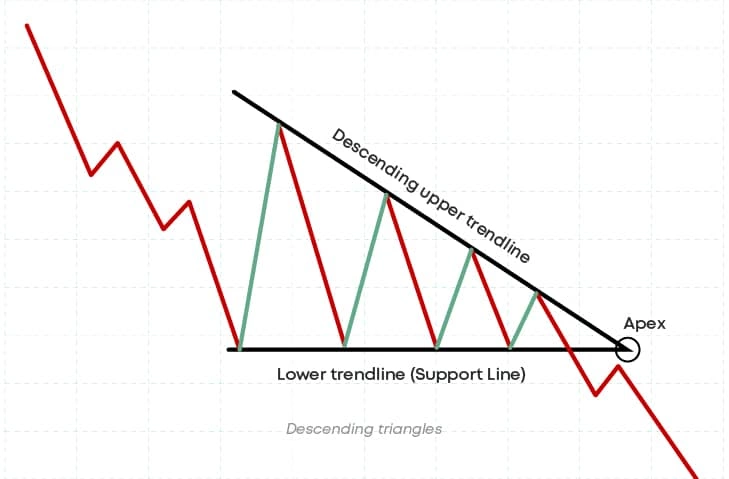
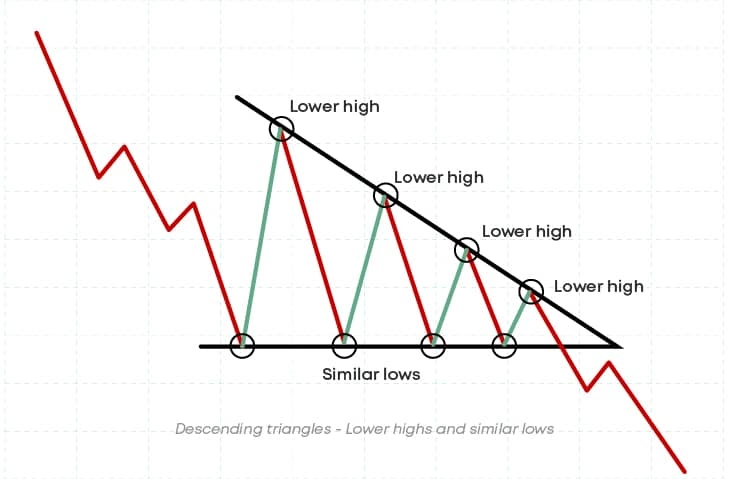
A descending triangle pattern is the opposite of an ascending triangle. It signals a bearish trend in the market and includes two main trendlines: upper and lower. The upper trendline goes downward, showing a series of lower highs where sellers are consistently pushing prices down. Meanwhile, the lower trendline stays horizontal, connecting points where the price hits similar lows, showing weak support from buyers.
The trendlines merge at the "apex," which is situated at the right of the chart, as the range between the highs and lows that show the price's movement gets smaller. The vertical line measuring the height of the pattern at the left of the chart is the "base" of the triangle. That is how the pattern resembles a triangle and suggests that the price is likely to fall lower once the sellers' pressure breaks through the support level.
How the bearish bias implied by the downward-sloping upper trendline suggest increasing selling pressure?
A falling triangle is a chart pattern that frequently indicates a bearish trend in the market. When the top trendline slides downward, it shows a series of lower highs where sellers apply more pressure, pushing prices down more strongly each time.
The bottom trendline stays horizontal connecting positions when prices reach equal lows, signalling weak buyer demand. As these lines meet, the pattern forms a triangle, indicating that the price will decline. This is due to weak support at the lower trendline that often gets wiped out by the ongoing and increasing selling pressure from the ascending upper trendline.
The logic behind descending triangles
The logic behind downtrend triangle patterns is based on the dynamics between sellers and buyers that are strong selling pressure and weak buying pressure. Sellers are continuously decreasing the highs, which is driving the price down, according to the descending trendline. However, the horizontal lower trendline shows that there isn't enough buying demand to drive the price higher. This weak support will eventually fall under the pressure of selling, potentially resulting in a price decrease.
Interpretation and Trading Signals
During this period, sellers continuously force the price lower, as shown by the descending upper trendline. This suggests that sellers are selling their stakes at increasingly lower prices. In the meantime, buyers are unable to produce major purchasing pressure, as shown by the lower trendline, which is flat or slightly rising and serves as weak support. Such poor support shows that buyers can only temporarily hold the price at a specific level and can't stop the general decreasing trend.
The significance of breakouts from the triangle
Breakouts from falling triangles are important because they have strong bearish implications. A breakout occurs when the price moves hugely below the lower horizontal trendline, which means a bearish breakout. In descending triangle patterns, these breakouts usually mean the continuation of a current decline or the beginning of a new downtrend. This bearish breakout occurs when sustained selling pressure ultimately exceeds the weak support level, causing a significant drop in price. Traders and experts often consider such breakouts as evidence of bearish sentiment in the market, implying that additional price drops are near.
The role of volume in confirming breakouts
Volume is key in verifying breakouts from a descending triangle chart pattern. When the price moves strongly below the lower horizontal trendline, a rise in trading volume provides solid confirmation of the breakout. High volume suggests that a large number of traders are involved in the movement, providing trust to the breakout. Conversely, if the breakout comes on low volume, it may indicate a lack of commitment among traders, increasing the possibility of a fake breakout. Therefore, keeping an eye on volume enables traders and analysts to evaluate the reliability and strength of a breakout, confirming that the price movement is supported by market activity.
Target Price and Risk Management
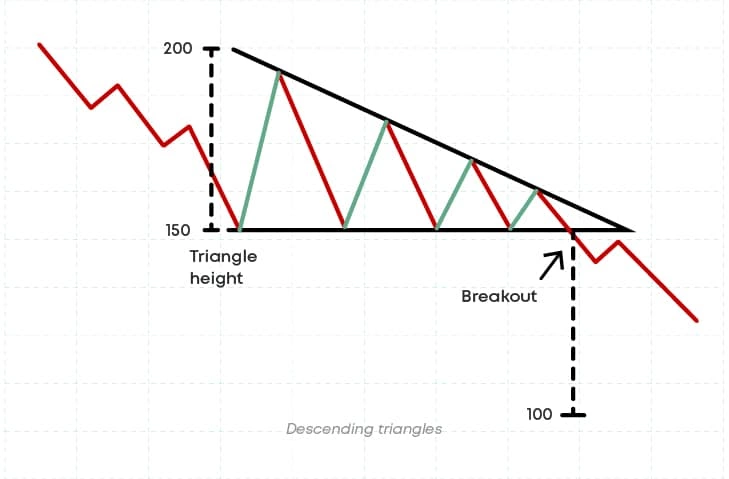
Traders apply a simple approach to predict how far the market will fall after a bearish breakout from a downtrend triangle pattern. They begin by measuring the triangle's height, which is the distance between the highest and lowest points on the upper and lower trendlines from the base to the peak of the triangle. The breakout point should then be displayed at a given distance along the pattern's horizontal width. Traders will approach the triangle cautiously if prices stay inside the trendlines beyond the triangle's three-quarters point. If prices don't break through the trendlines before then, the triangle usually loses strength and prices just float past the apex with no surge.
Imagine a descending triangle with 200 as its highest point and 150 as the lowest. (200 - 150 = 50) is the pattern's height. So, 150 is the apex. When a breakout occurs on the downside, the target price is 100 (150 - 50 = 100), and if the breakout occurs on the upside, it is 180 (150 + 30 = 180).
Such flow provides an expected target price, indicating where the price will find support or pause following a breakout. This strategy assists traders in setting realistic targets and managing their risk in how far the price may fall.
The possibility of false breakouts below the lower trendline.
Traders often worry about false breakouts below the bottom trendline in descending triangle patterns. They frequently search for confirmation signs that support the bearish breakout signal in order to reduce the possibility of fake breakouts. For example, when the price falls below the lower trendline for a limited period of time but fails to maintain its falling progress, this is known as a false signal.
Trades can increase the validity of the bearish breakout signal from the descending triangle, lower the chance of false breakouts, and make better trading decisions by combining confirmation signals like the above-mentioned volume and technical indicators such as Relative Strength Index (RSI) or Moving Average Convergence Divergence (MACD).
Variations of Breakouts and Related Patterns of Descending Triangles
Descent triangle breakouts can appear in a variety of ways, each with unique characteristics:
- Breakout with Pullback:
This variation shows a price break below the lower trendline, followed by a return into the triangle pattern and further declines. Before the market resumes its downward trend, it frequently pulls back to verify whether the breakout level is still valid.
- Breakout with Reset:
Breakout with Reset happens when the price breaks below the lower trendline, but instead of going straight downwards, it goes flat for a while before resuming the downtrend. So that, before the downturn resumes, this "reset" phase gives the market time to build momentum.
- Breakout with Double Bottom:
A double bottom is a reversal pattern of an ongoing price decline. It indicates that a downtrend is transitioning into an uptrend. This is when there is a brief period of accumulation or stabilization preceding the ultimate breakout, which could result in a more significant decline. Schabacker describes the double bottom as a "misunderstood formation." And Bulkowski estimates its 64% failure probability, which he describes as unusually high.
All these variations emphasize how volatile market movements may be and how crucial it is to keep a close eye on volume and price activity in order to validate breakouts and accurately predict future price changes.
Descending, ascending, or symmetrical triangles?
Technical analysis uses chart patterns such as descending triangles, symmetrical triangles, and ascending triangles, however, their implications for price movement differ:
Descending Triangles are bearish chart patterns defined by an upper trendline that falls downward and a lower trendline that either slides horizontally or slightly upwards. Usually, declining triangles signal the start of a new decline or the possible continuation of an existing one. Meanwhile, symmetrical triangles are characterized by a lack of directional bias. Here the market may be going through a phase of stabilization and hesitation, with neither buyers nor sellers gaining any swing. And finally, a rising lower trendline and a horizontal upper trendline define ascending triangles as bullish chart patterns. Usually, ascending triangles signal the start of a new uptrend or the possible continuation of an existing one.
So, descending triangle chart patterns show a bearish bias, ascending triangles imply a bullish bias, while symmetrical triangles lack a directional bias. To make well-informed decisions on the direction of the market and possible price changes, traders examine these patterns in addition to other technical indicators.
Conclusion
A descending top trendline and a horizontal or slightly upward-sloping lower trendline define descending triangles, which are bearish chart patterns. This pattern points to a level of support that continues to decline as sellers drive the price down.
Understanding the bearish bias shown by the declining support level and the pattern of lower highs is essential for knowing how to interpret descending triangles. After an established breakout below the lower trendline, traders expect a possible downtrend continuation or the start of a new decline. An increase in trading volume usually follows the breakout, indicating that the pattern is trustworthy.
When a descending triangle confirms a breakout below the lower trendline, selling possibilities are among the trading signals connected with it. In order to determine price objectives, traders frequently project the triangle's height below the breakout point. The bearish breakout signal can also be enhanced and trading decisions validated by confirmation signals like increased trade volume and technical indicators like momentum analyzers. In general, declining triangles are valuable markers of upcoming market downtrends.
FAQ
Is a descending triangle bearish?
Yes, a bearish trend is indicated by descending triangles. They can be identified by an upper trendline that falls downward and a lower trendline that is straight or slightly upward, indicating a decreasing support level and the possibility of a price decline.
What are the key visual features of a descending triangle on a crypto chart?
The lower highs along the upper trendline and roughly equal lows along the lower trendline are the key visual elements of the descending triangle.
What role does volume play in interpreting a descending triangle breakout?
High volume indicates active trading, which raises the possibility of more declines.
Does a descending triangle guarantee a price drop?
Even though they are bearish patterns, descending triangles don't always result in downward movement. Before investing, it is recommended to take into account additional market factors.
Can descending triangles turn bullish?
Very rare. Triangles in decline tend to be bearish in nature and seldom become bullish.
Disclaimer: Includes third-party opinions. No financial advice.


