
The Golden Pocket Explained
What do the Pyramid of Giza, the Mona Lisa, and cryptocurrencies share with the Twitter logo? All of them are connected with the Golden Ratio. In the following article, we will examine what it is and how to use it in the digital currency world.
The Golden Ratio or the “Divine proportion” is the rule of the relationship between parts and the whole, a universal code of beauty and symmetry. It is found in science, nature, architecture, and art. People tend to look for patterns everywhere, even where there are none. Euclid was the first to write about the golden ratio in “Elements,” which at one time was second in popularity after the Bible telling that the entire universe is built on numbers. Leonardo da Vinci, for example, believed that the golden ratio is an expression of the divine essence of the Trinity. The pioneers of the Renaissance Pacioli and Leonardo da Vinci ("The Last Supper" and "Mona Lisa" are inscribed in geometric figures) turned their attention to antiquity.
The Italian astronomer and mathematician Fibonacci derived a series of numbers in which the value of each subsequent one is equal to the sum of the previous two. This pattern is known as the Fibonacci series. During price swings, a cryptocurrency tends to hit resistance. Following each resistance level, which traders call the Golden Pocket, the next number in the Fibonacci sequence represents the next potential resistance level. Due to this possibility, many traders take gains at these levels.
How to do this correctly, everyone decides for themselves. There are many variations of the golden ratio that can help with the analysis of trading and bring significant results. But all of them, one way or another, are based on Fibonacci numbers.
Let’s see what is the golden pocket in trading and how it works.
Demystifying the Golden Pocket
The Fibonacci sequence is often used as a trading tool. Imagine it represents two squares placed side by side, and when adding a square with a double side, you get a 2 by 2 square. Later, adding the sum of the previous two squares in a counterclockwise spiral you get a square with a long side of three squares. Then add the previous side to the side of the square, and you get 5, then 8 then 13, and 21, each subsequent number is the sum of the addition with the previous one, that is, the sequence that Fibonacci derived is obtained: 0,1,1,2,3,5,8,13,21 and etc.".
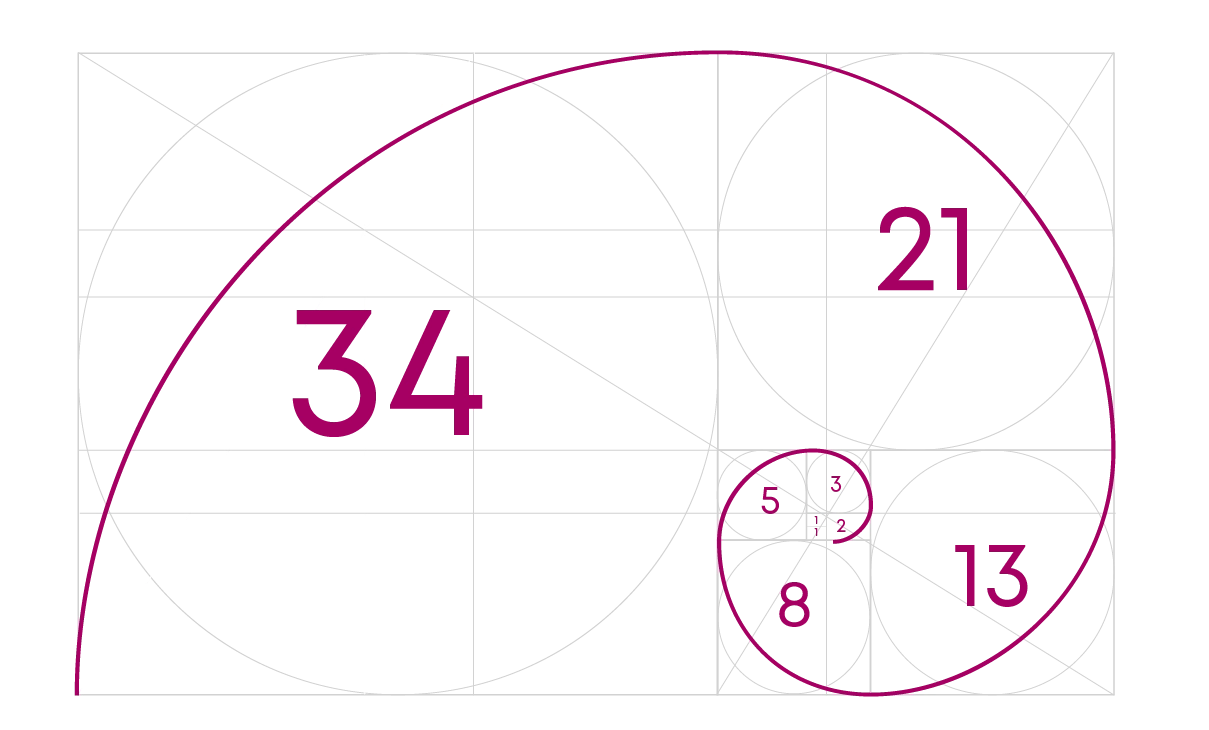
0, 1 (0+1), 2 (1+1), 3 (1+2), 5 (2+3), 8 (3+5), 13 (5+8), 21 (8+ 13), 34 (13+21), etc. The golden ratio is obtained when dividing the next number by the previous one. As the numbers increase, the ratio approaches 1.618. For example, the numbers 3 and 5, their ratio is 1.666, and if you take 13 and 21, you get 1.625.
This formula is used to calculate the proportions of the golden section in any industry. In practice, the rounded value of 1.618 is most often used called the number phi. And if in each square you build an arc from one corner to another, you get the so-called Fibonacci spiral.
In trading the understanding of the Fibonacci Golden Ratio is a helpful technique for gaining information and making the right analysis. Fibonacci retracement ratios are commonly used by traders to identify support and resistance fib levels on price charts. Traders can decide and produce more profitable Golden Pocket trading strategies by knowing and utilizing these ratios correctly.
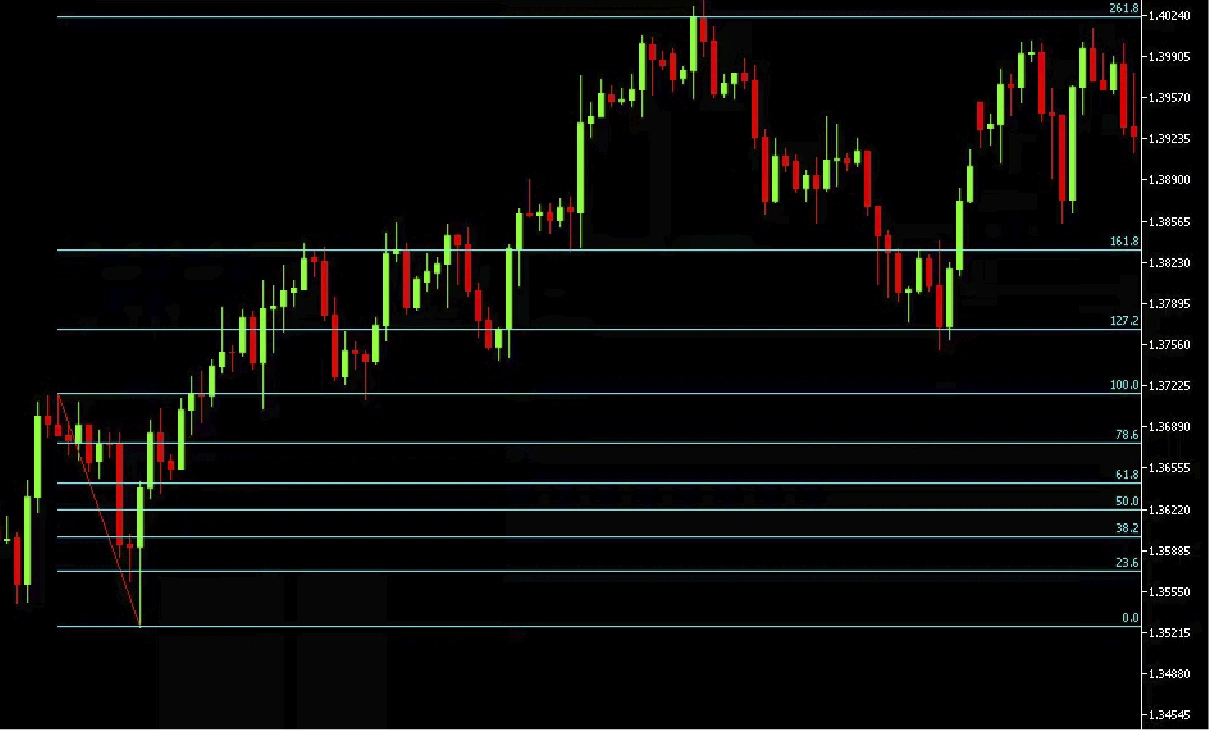
It is recommended to use Fibonacci along with other trading standards to improve the quality of trade fractions that you have previously recognized. Fibonacci extension levels include 23.6%, 38.2%,61.8%, 100%, 161.8%, 200%, and 261.8%. Those are helpful to see potential support and resistance levels when they are difficult to spot. They also function as a price magnet when setting profit goals for transactions.
Once the value of a digital asset falls, the Fibonacci extension uses precise ratios (such as 61.8%, 100%, and so on) to forecast where it will rebound. For example, if a cryptocurrency's value falls to 61.8%, it talks about its ability to regain around 61.8% of its prior peak. This gives traders target levels to place buy or sell orders.
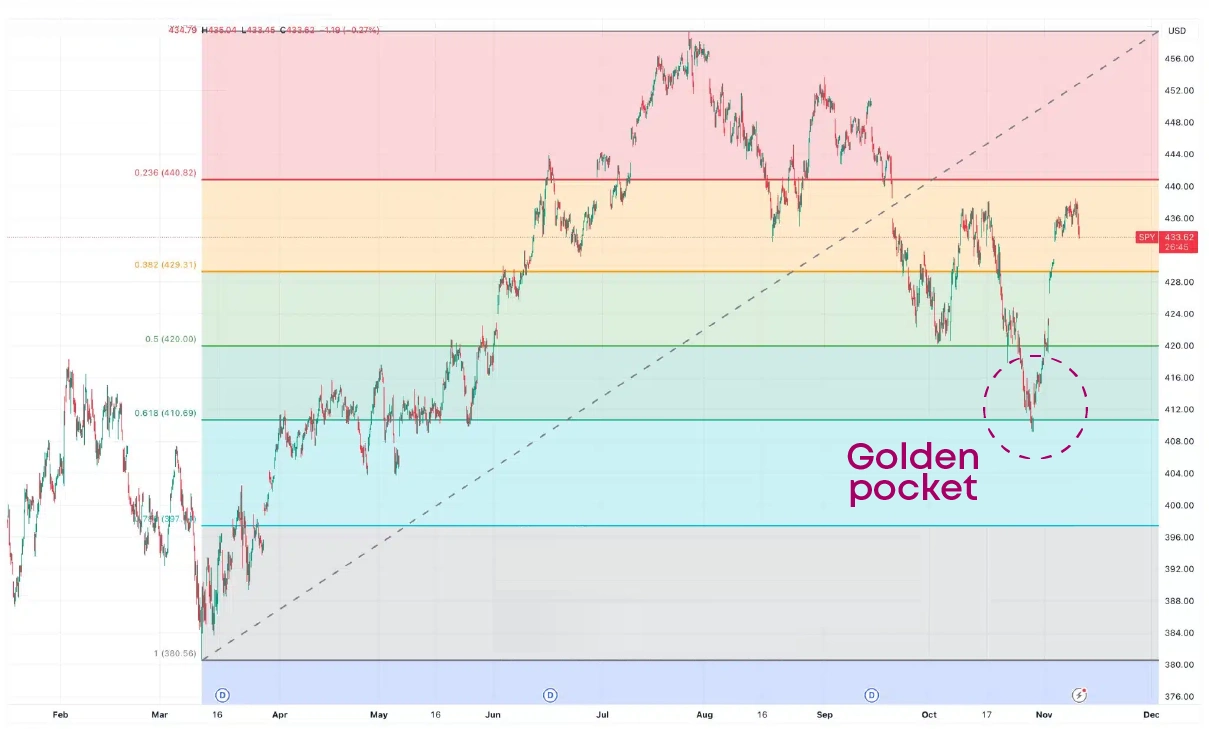
Fibonacci Golden Pocket is commonly thought to fall between 0.618 (or -61.8%) and 0.65 (or -65%). This level is critical because it frequently marks a big turning stage for a currency's price.
The Golden Pocket in Action: What is the Golden Pocket in Trading?
Fibonacci extensions are very useful for trend-following since they encourage us to look for price movements that go beyond the existing range. Learning the levels of Fibonacci retracement allows us to recognize support and resistance zones, manage risk properly, and improve trading techniques.
When an asset is moving up and takes a break, traders keep an eye on its Golden Pocket. This zone signals a potential turnaround and a rise in price afterward being a perfect spot to enter the trade, offering good potential gains compared to the risk. To locate the Fibonacci Golden Zone, it is recommended to measure from the lowest recent price to the highest recent price in the Fibonacci chart. During pullbacks, this zone acts as a support level where traders anticipate price reversals and potential upward movements. When the price starts to pull back, we watch for it to hit the Golden Pocket range, typically between 0.618 and 0.65. That's exactly where the price tends to bounce back up. Conversely, in ranging markets, the Golden Pocket can act as both support and resistance, guiding traders in identifying optimal entry and exit points. Thus, understanding the Fibo Golden Pocket's role allows traders to make informed decisions across various market conditions, enhancing trading strategies.
The reversal indicator uses Fibonacci Ratios to determine entry and exit points. For example, during an upward trend, it detects spots (such as 161.8%) when the trend stops, signaling a likely transition to a downturn. Recognizing golden pocket fib levels assists traders in determining when it is best to purchase or sell.
As per Elliottwave analysis when more technical factors line up with a particular retracement level, the chance of a reversal increases. In the picture above, the 61.8% retracement level coincides with a strong resistance level, making reversals common and smooth. Other indicators like trendlines, moving averages, and volume also contribute to stronger reversals. For more predictions, you can check out the Best Stock Forecasts & Prediction Services & Websites in 2024.
Beyond the Golden Pocket: Fibonacci Secrets for Savvy Traders
Let's analyze how 38.2% and 50% Golden Pocket fib retracement levels interact in the Golden Pocket.
The 38.2% retracement is often taken as the first possible support or resistance zone after a strong price fluctuation. So if the value simply returns to 38.2% and then rapidly recovers, it indicates the previous trend whether upward or downward, will likely resume without much delay so the trend is likely to persist without a significant interruption. In contrast, a price inactivity or reversal around 38.2% may signal a weaker trend or possibly a shift in direction.
The 50% retracement level is a physiological challenge for many traders. Price dropping to 50% can be viewed as an inviting purchasing opportunity, perhaps leading to a return and continuing of the rise. When a price reaches 50%, traders who want to grab profits or anticipate another drop and sell.
Nonetheless, DEXs are also not as perfect as they seem. Usually, they are less user-friendly than centralized exchanges, and their trading volume is typically lower. Due to the blockchain network's limitations, transactions on DEXs can also be slower and more expensive. Yes, more expensive for you.
Accordingly, additional possible resistance zones are found at 38.2% and 50% retracement levels. So if the price finds support/resistance within this range it increases the overall indication of a possible trend stop or reversal.
Fibonacci fan lines and speed resistance arcs
A Fibonacci fan is another charting technique where you need to explore chart patterns and trends. To show and forecast different support and resistance levels Fibonacci fan lines use the Golden ratio. Rising fan lines start at the bottom and go through retracements depending on the advance and Fibonacci retracement points.
Here is how it works: The fan lines are used to predict probable reversal zones or support levels as follows: Falling fan lines descend from a high and cover retracements determined by the drop (peak to trough), eventually indicating possible reversal zones or resistance levels. The fan lines provide chart monitoring as prices fluctuate. The Fibonacci Fan lines may be used to pinpoint possible regions of resistance or reversal following a fall. Support and resistance zones grow as the Fibonacci Fan lines grow, much like ordinary line patterns do. This makes them dynamic rather than static.
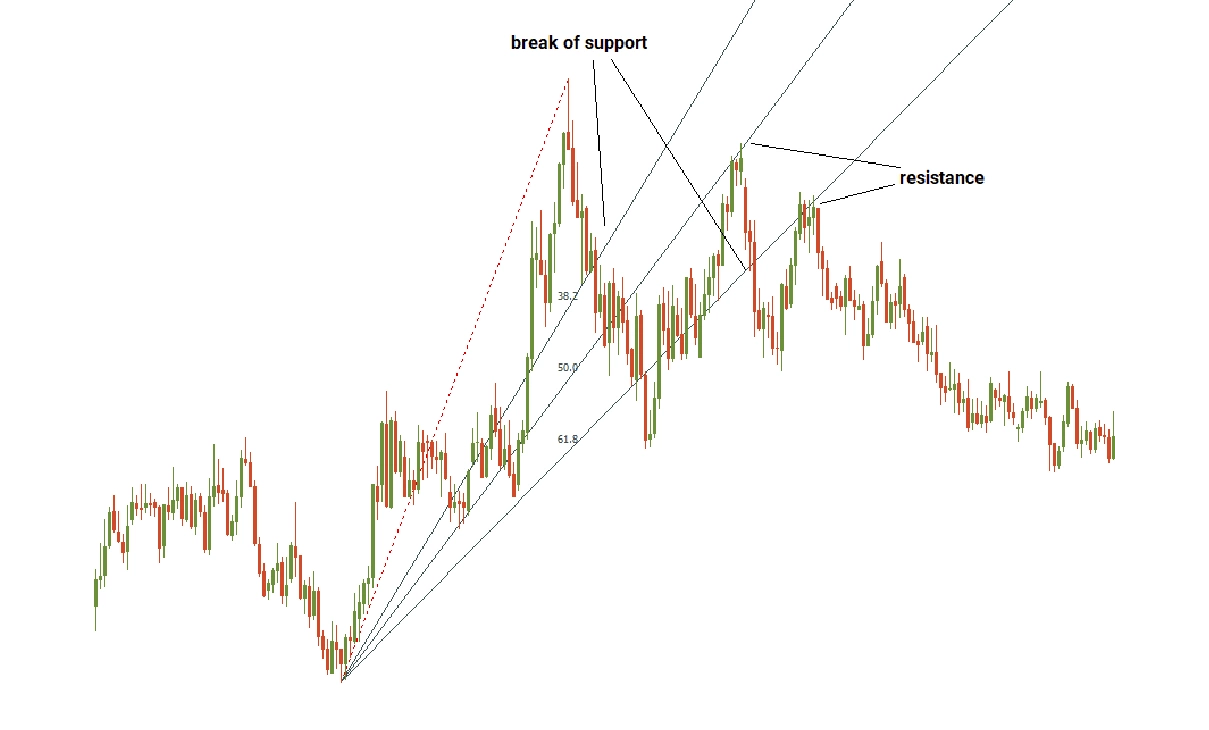
Helping to analyze trends, the fan lines are displayed by drawing between two extreme points. The trendlines are drawn from a high or a low of the price chart through 38.2%, 50%, and 61.8% retracements. Through the lines, we can see the support or resistance pinpointing areas at which the price may reverse and indicate. The fan line represents a stronger ongoing trend or a probable trend change.
We can also apply Speed/Resistance Arcs, in which the price stays above the upper arc and falls to the lower arc, which serves as a support level.
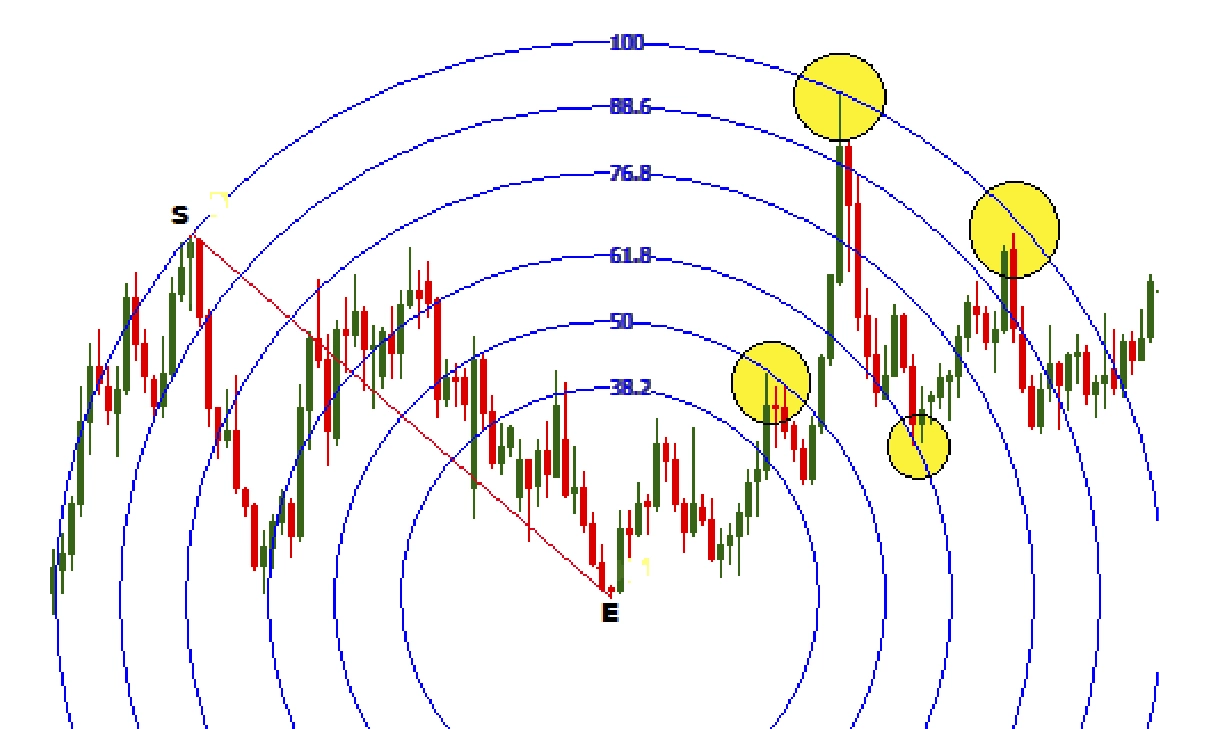
Here S refers to the starting point, whereas E symbolizes the finishing point. The marked Fibonacci arcs show major resistance.
Potential limitations and pitfalls of relying solely on Fibonacci techniques
Fibonacci Golden pocket retracements are mainly applied by many traders during their careers. While some people will only utilize them sometimes, others will do so daily. Therefore, it is essential to employ this tool correctly every time, regardless of how frequently you use it.
Applying incorrect techniques may bring severe effects, including poor entry points and increasing losses on transactions. It is recommended to make a proper analysis before investment and be aware of typical errors so that you will be able to keep away from trading gaps and protect your investments from unpleasant results by obtaining good crypto portfolio diversification.
Accordingly, it is difficult to guarantee that the price of a particular stock won't rise above or fall below expectations.
Golden Ratio in Modern Markets
Fibonacci retracement levels have a significant impact on market behavior, notably through the recognition of probable support and resistance zones. Traders pay particular attention to levels, which include 38.2%, 50%, and 61.8%, in order to measure market mood and forecast price moves. Price reactions at these levels frequently determine whether a trend will persist or reverse order, reflecting the participants' collective psychological makeup.
According to Renat Mansurov – venture investor, fundraiser, and MBA expert in the field of “Investments in the field of innovation” the theory of the golden section and “divine proportions” is quite popular, but science does not stand still, and theories of perception are now being actively studied from a scientific point of view. “What has been working in practice for more than one century should remind you every time that these proportions have been tested by time and hundreds of thousands of creative people: photographers, artists, designers, and architects work every day and use golden proportions in their work.
The application of mathematical concepts in trading, such as Fibonacci retracement levels, poses various philosophical and ethical concerns. Traders who use mathematical patterns must examine the ethical consequences of their decisions, particularly in terms of risk management. Dependence on mathematical models without a solid knowledge of the market's fundamentals can lead to high levels of risk to cause marketplace unpredictability. As a result, market players and regulators must acknowledge the possible lasting effects of relying too heavily on statistical trends in trading and put in place protections to limit these risks and maintain financial market stability.
Conclusion
To summarize, the golden ratio symbolizes a sequence, a proportion, and segments of a specific length, other geometric forms, or related dimensional properties of actual things. Nature, art, and architecture rely on this innate proportion to maintain balance.
In many architectural constructions and home design projects, the golden ratio proportion is used in the planning, subdivision, furniture placement, and color scheme of modern interior spaces. It is also utilized in landscape architecture when designing winding pathways, planting flower beds, and other architectural features.
In the financial world, Fibonacci retracement analysis is an effective technique for traders, providing insight into probable price levels and market behavior. Learning Fibonacci retracement levels helps to identify support and resistance zones, manage risk properly, and improve your trading technique.
Understanding these hazards and exercising caution when utilizing Fibonacci tools can help you make wise Golden Pocket trading decisions and maybe enhance your trading career as a whole. Recall that risk management, discipline, and a healthy dose of doubt regarding any one indicator are necessary for effective trading.
FAQ
What is the Golden Ratio and where does it come from?
The golden Ratio (around 1.618) is a mathematical sequence that is found in nature, art, and aesthetics, having its roots in Greek mathematics.
How is the Golden Ratio related to the Fibonacci sequence?
The Fibonacci sequence, in which each number equals the sum of the two numbers before it, and the Golden Ratio are closely related and here the Fibonacci sequence's ratio approaches the Golden Ratio, or around 1.618.
What is the Golden Pocket and how is it calculated?
In trading analysis, The Golden Pocket is a region between the 61.8% and 65% retracement levels. It's calculated using Fibonacci retracement levels applied to a price chart.
What are the different Fibonacci retracement levels?
Fibonacci extension levels include 23.6%, 38.2%,61.8%, 100%, 161.8%, 200%, and 261.8%.
How can I use the Golden Pocket for entry and exit points in trades?
Traders search for price movement during market trends in order to use the Golden Pocket as a point of entrance and exit.
How does the Golden Pocket act as a support and resistance zone?
The Golden Pocket is a strong support or resistance zone that reflects traders’ behavior and market psychology.
Disclaimer: Includes third-party opinions. No financial advice.


